Wages, Inflation, and Price Comparisons in the U.S. Pre and Post Gold Standard

Remember the old stories about a nickel candy bar and ten cent gasoline? My, how far we have come, and the trip has only cost us $17 Trillion.
When referring to the chart below, ask yourself this question: “How can I maintain my purchasing power when these long-term trends show that the Dollar loses a substantial amount of purchasing power over time?” To discuss this in issue in-depth and develop a strategy that can work for you, call your ITM Trading Representative at 1.888.OWN.GOLD.
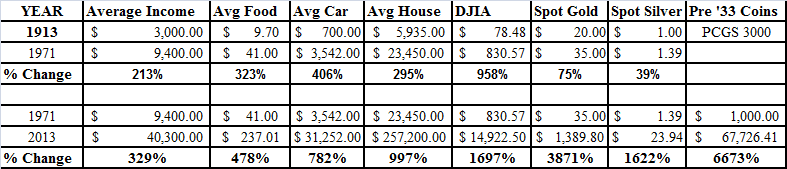
Inflation Statistics From 1913 to 2013, Pre and Post Gold Standard
As the old Dan Akroyd Saturday Night Live skit said, “Think of inflation as your friend. Wouldn’t you like to own a $4,000 suit, and smoke a $75 cigar, drive a $600,000 car? I know I would! ”
Let’s take Saturday Night Live philosophy a step further. If we were to extrapolate this data forward 42 years, lets see what we get:
The average wage earner will make $132,587.00, he or she will drive a $244,390.00 car and live in a $2.5 Million Dollar house, and will buy a cart of groceries that costs $1133.00. These numbers are simply astounding, and they certainly don’t seem feasible. By this point we will need $1000 and $10,000 bills to carry in our wallets. Your daily ATM withdrawal limit will probably be $5000. The cost of a tank of gas will probably be around $200.00, and I don’t even want to think about what the car insurance will cost. Expect taxes to be higher as well, all of them.
If you would like to save for this extrapolated financial catastrophe, may we suggest gold and silver. Using the same data, we can extrapolate gold to $53,799.00 an ounce, and silver at $388.00 an ounce. At this juncture, trying to call the future value of rare U.S. gold coins is an exercise in market fantasy. Currently, it is not uncommon at all for a rare coin to trade at 2-4 times the spot value of gold bullion. If this relationship holds true over time then $100,000 – $200,000 Rare U.S. Mint Double Eagles may be the norm in the rare coin market.
While these forward numbers are based on historical data and may or may not be accurate 40+ years from now, one thing we do know for certain is that Gold and Silver are a store of value and they maintain their purchasing power over time and have done so for thousands of years.
All portfolios should have a very certain amount of diversification, and portfolios that are 100% in Dollar denominated assets truly have no diversification at all against Dollar collapse. Perhaps 10% – 20% of your assets set aside in rare gold and silver will pay-off like a 40 to 1 long-shot at the Kentucky Derby, but on thing is for certain, staying 100% invested in the Dollar is tantamount to betting on the old grey mare, she just ain’t what she used to be.