
What to Expect Next: The Longest Yield Curve Inversion Explained
When the economy shows signs of trouble, financial experts often refer to a critical indicator known as the yield curve inversion. This powerful tool has accurately predicted recessions dating back to World War II. However, recent developments in the economy have left many investors feeling uncertain. After nearly two years of inversion, the yield curve recently disinverted, prompting some to celebrate prematurely, believing a recession was avoided.
Before jumping to conclusions, it’s essential to understand the mechanics behind the yield curve, how it operates, and why this disinversion is actually a recession indicator signaling that economic pain may still be on the horizon.
What is the Yield Curve and How Does It Work?
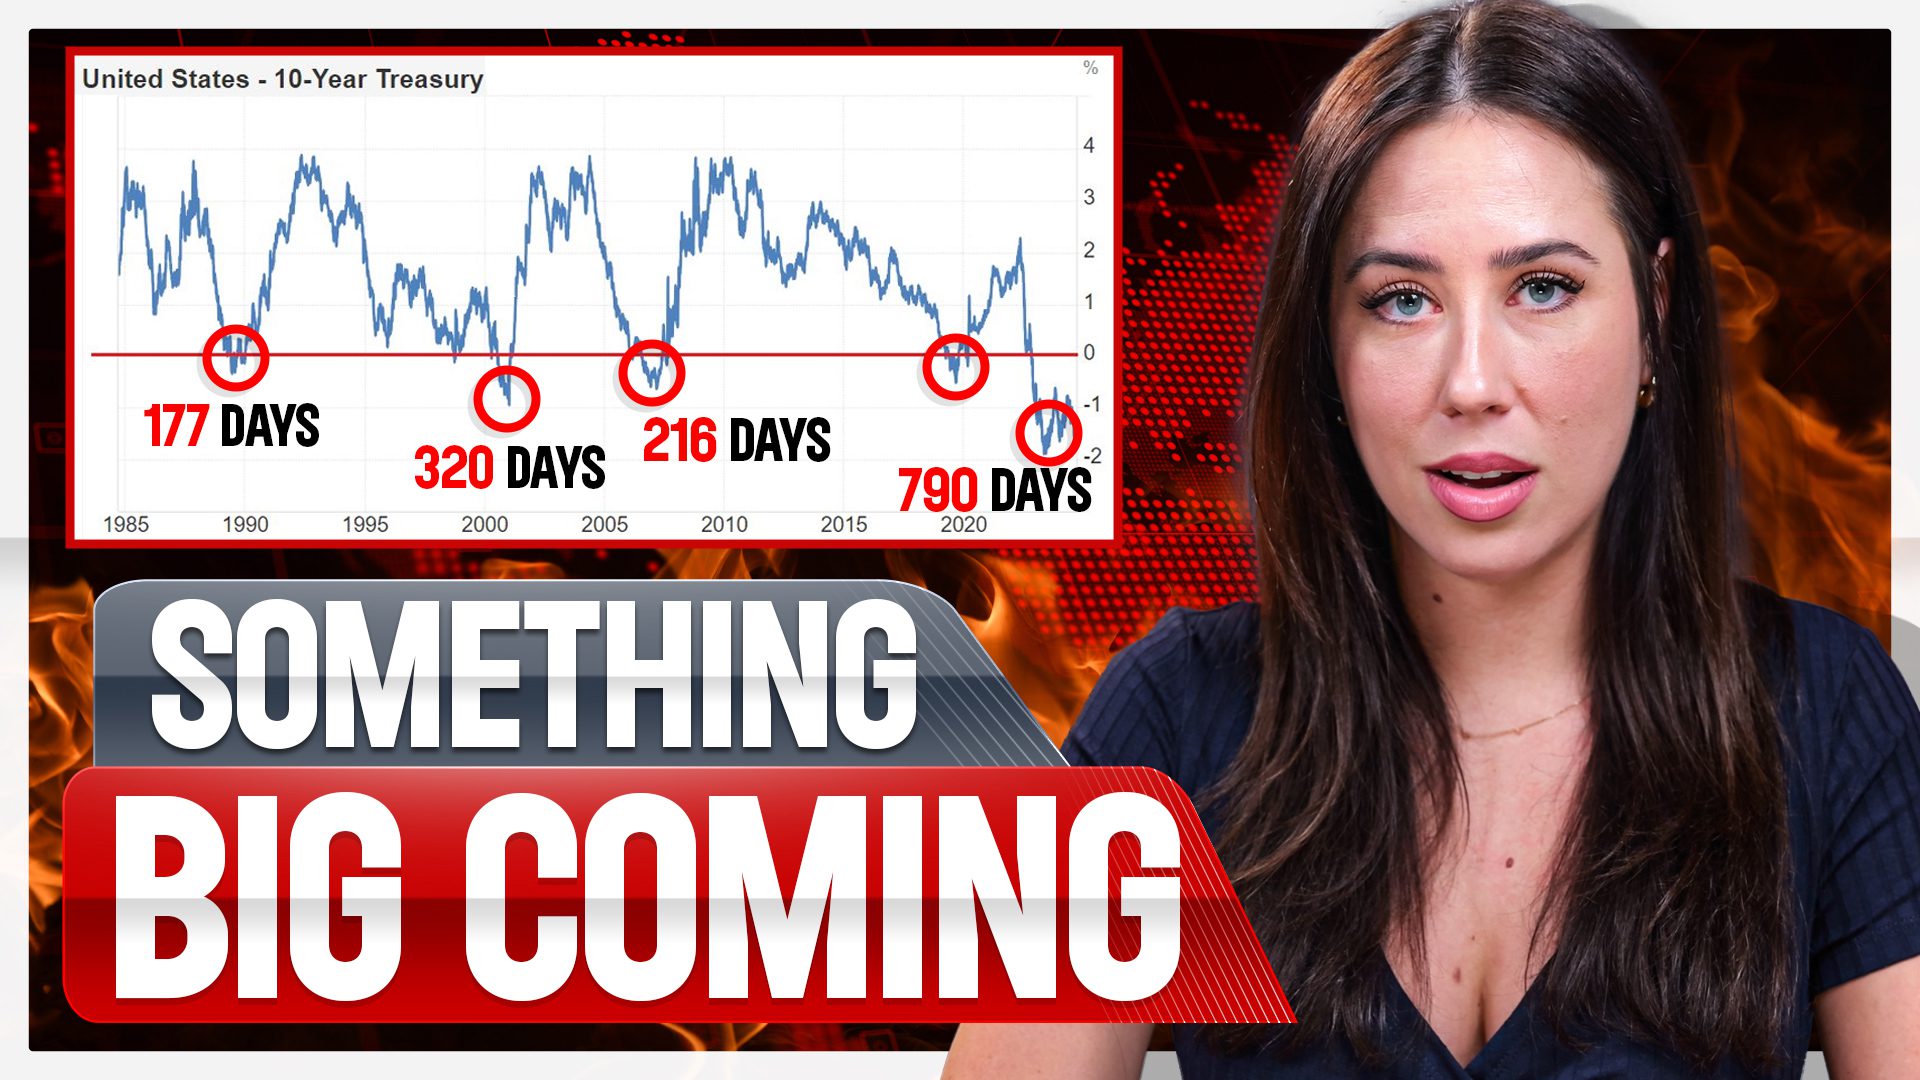
In simple terms, the yield curve shows the relationship between interest rates (or yields) and the length of time you invest in government bonds. Treasury bonds are essentially loans you give to the government, for which they pay you interest. When looking at the yield curve, we typically compare two key bonds: the 10-year Treasury (long-term) and the 2-year Treasury (short-term).
In a healthy economy, long-term bonds usually offer higher yields because investors expect to be compensated more for tying up their money for longer periods. However, when the economy is unstable, the relationship flips—short-term bonds may offer higher yields, causing an inversion of the yield curve.
Historically, an inverted yield curve has been one of the most reliable recession indicators. It signals that investors have lost confidence in the near-term economy and are moving their money into safer, long-term investments.
Why the Recent Disinversion Isn’t a Sign of Relief
While the recent disinversion of the yield curve may seem like good news, history shows that this is far from a signal of recovery. In fact, a disinversion often indicates that a recession is imminent. A look back at previous economic cycles reveals that each time the yield curve returned to normal following an inversion, a recession soon followed.
For example, in 2001, after the yield curve disinverted, the economy experienced a recession shortly after. The same happened in 2008, and now in 2024, the pattern seems to be repeating itself. Despite the curve “normalizing,” the underlying economic conditions remain fragile.
The Federal Reserve’s Role and Rate Cuts
Another key factor to consider is the Federal Reserve’s rate cuts. In response to economic challenges, the Federal Reserve often cuts interest rates to stimulate growth. While this initially provides hope and optimism for a soft landing, it can also be a false sense of security. When the yield curve steepens after a rate cut, it often signals that the most severe economic pain is still to come.
Currently, the Federal Reserve is facing pressure to cut rates again, which may temporarily correct the yield curve. However, as we’ve seen in past recessions, the steepening phase of the yield curve is often when the true economic challenges begin to unfold.
History Repeats Itself
The 27-month mark is a critical number in this current cycle. It took 27 months from the initial yield curve inversion in 2008 before the recession hit. Fast forward to today, and we are seeing the same timeline, which suggests that the U.S. economy is still on track for a significant downturn.
As history continues to repeat itself, the need for proper financial strategies becomes more urgent. Now is the time to protect your wealth and safeguard your financial future.
What You Should Do Next
At ITM Trading, we specialize in helping individuals prepare for times of economic uncertainty by incorporating gold and silver into their portfolios. If you’re unsure about your current financial strategy or would like a second opinion, we encourage you to speak with one of our expert analysts. They are trained to help you navigate market volatility and protect your wealth for the long term.
Conclusion
As we’ve seen, the disinversion of the yield curve is not a sign of economic recovery but a warning that a recession may be closer than anticipated. By understanding these key financial concepts, you can take the necessary steps to safeguard your future. If you haven’t already, now is the time to ensure you have a strategy in place. At ITM Trading, we’re here to help you every step of the way.
Talk to one of our expert analysts today at no cost to you. Whether you’re looking to create a strategy or get a second opinion on your current plan, we are here to help. Protect your wealth with the trusted guidance of ITM Trading, your source for all things gold, silver, and lifelong wealth protection.
Call us at 866-351-4219 or Schedule My Free Strategy Session