Performance of Bullion and Numismatic Coins

No one can deny that we are currently experiencing a gold bull market. The spot price of gold has been increasing for the past nine years. It came off a low of $272 per ounce in 2001 to where it sits today at $1,158 per ounce. The following graph depicts the percentage increases per year for the last nine years and gives an average. The average gain for the last nine years is 17.1%. Not bad at all. Anyone would be happy to get 17.1% per year for nine years straight. Since this blog is about owning rare gold coins let’s look at what numismatic/U.S. rare gold coins have done in that same time frame.
|
|
USD |
|
2001 |
2.5% |
|
2002 |
24.7% |
|
2003 |
19.6% |
|
2004 |
5.2% |
|
2005 |
18.2% |
|
2006 |
22.8% |
|
2007 |
31.4% |
|
2008 |
5.8% |
|
2009 |
23.9% |
|
Average |
17.1% |
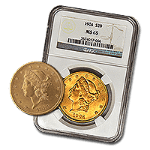
I took the most common mint state 64 grade $20 Saint Gaudens to achieve a very easy to understand baseline figure. Over the past nine years that coin has achieved an average appreciation of 31.8% per year. This is almost twice what bullion did over the same time frame. Who wouldn’t love to get 31.8% per year return on their money? In addition, most better dated coins have performed even better.
For a better dated coin I randomly chose a 1903P $20 Liberty in mint state 64 condition, and found that over the same time frame it had appreciated an average of 39.8%. That is 8% better per year on average for the last nine years. That is great.
What this has shown is that during this bull market thus far, it is better to own numismatic gold coins than it is to own bullion based strictly on performance. It is even better to own rarer issues as displayed by performance. It is commonly known in the industry that the rarer the issue the more potential for growth there is. It should be noted that past performance is no indication of future performance and that you should do your own due diligence when investing in anything.