Money Trends

Welcome to the Strategy Explained webinar series. I’m Lynette Zang, Chief Market Analyst at ITM Trading since 2002. I’ve been in these markets on some level, since 1964 I’ve been a banker, a stock broker and studied currencies since 1987, so you could say that I’ve been groomed for this period of time.
I believe strongly that everyone needs to have a basic understanding of the markets so that you can make educated choices on your own. Basic common identifiable patterns occur in every trend. Today’s webinar will focus on simplifying the identification of patterns inherent in each phase, what to look for and what you’ll most likely hear.
A little disclaimer before we get started: Everything we’ll discuss today are my opinions and do not necessarily represent the official opinion of ITM Trading. “ITM recommends that 5 to 20% of your overall investment portfolio be placed in precious metals, however the decision as to how much to allocate is strictly up to you and/or your financial adviser.â€
If you’d like us to email you a resource list with links so you can do your own due diligence, just ask your precious metals consultant and they’ll get that right out for you.
[Watch The Strategy Video Title: The Great Recession of 2008 Was Just A Warning!]
Let’s begin with why understanding trends and their patterns matters to you.
1. Best probability of buying low and selling high
2. Wealth held in negative trend in jeopardy
3. Future plans could be in jeopardy1st PHASE IS THE ACCUMULATION PHASE
You can see from this list that there are advantages for those who can identify the trend and the phases of a trend. Everyone wants to buy low and sell high, but you are up against professionals, so you could say the decks are stacked. But if you just understand some simple patterns, no one will be able to pull the wool over your eyes and you’ll have the best shot at long term positive results. As they say, the trend is your friend as long as you flow with it.
Today, all markets are openly manipulated by the global central banks money printing operations. So ask yourself, “How can I make investment choices that support my goals?â€
By understanding the true trend, let me show you how.
How to Identify the Long-Term Trend
Have you ever looked closely at a Surratt painting? He’s the artist that painted by putting down little dots of color and if you look closely, that’s what you see, little dots of color. But when you look from a distance, you see a beautiful beach scene with people sunbathing and sail boats.
The point is that anything can happen on a day to day basis, but if you really want to understand the truth… you need to have the ability to identify the bigger picture or long-term trend. You need to know if that trend is positive or negative, and which phase the trend is in, that’s it. It’s really very simple to identify a long-term trend, though identifying the phases are a bit more nuanced, but possible with a little practice. Then, of course, you have to believe what you see, which is typically the hardest for most people. However, with this basic skill, no one can manipulate you for their best interest. You’ll have the ability to make choices that are in your best interest.
It’s easy to assume that most people want a large portion of their wealth in a long-term positive trend, but we’ve been taught to be comfortable with fiat products and trained to look short-term “Oh the market went up or down today†but that’s like looking at the dots of color, stepping back and looking long-term shows you if a trend is positive or negative and can remove any short term “noise or manipulationsâ€.
That’s extremely important these days since manipulations and theft at the largest financial institutions are openly admitted and fines have become just a cost of doing business paid for by stockholders. What I’m about to show you is how to read intangible fiat markets.
This matters to you because understanding the trend and where we are in the trend cycle can enable educated choices regarding what, how and where to hold your wealth during any trend. It would also help you determine if any financial person truly understands how to read the trend, which would be of value in a financial advisor, but is NOT guaranteed.
First of all, time is the way to step back and look at a trend. Let me show you how.
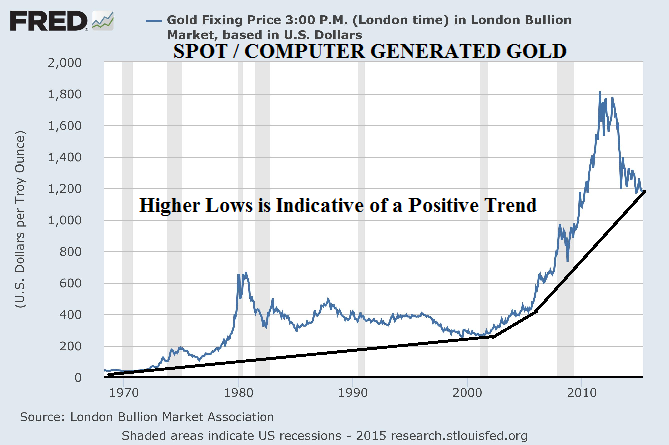
The chart below is of spot gold which is a proxy for commodity gold. The long-term trend indicated in this chart is positive.
A positive trend is indicated by a series of higher and higher lows. It may not feel like it if you bought in near a top, like in 2011, and there are very few guarantees that I can give you, but I can give you this one, if you keep getting higher and higher lows, you will ultimately get higher highs. So once you identify the positive trend, position your wealth and relax. If you have more to add, buy the dips, if you don’t just sit tight. The positive trend is your friend.
[Watch The Strategy Video Title: The Great Recession of 2008 Was Just A Warning!]
Below is a US dollar Index chart and represents US fiat money against a standard basket of other fiat money; the euro, yen, Swiss franc, British pound, Swedish corona and the Canadian dollar. The long term trend indicated in this chart is negative.
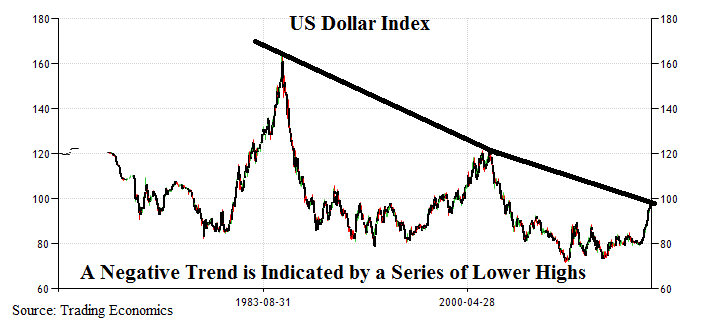
A negative trend is indicated by a series of lower and lower highs. Here’s another guarantee, if you keep getting lower highs, you will ultimately get lower lows. Fiat money is the foundation of all fiat money products; stocks, bonds, cd’s, in fact any intangible financial instrument. That’s why I say the fiat money trend is the most important trend right now, because, regardless of the manipulations in the stock and bond market making them look as if they’re in a positive trend, this is the foundational trend and you can see for yourself, it is negative.
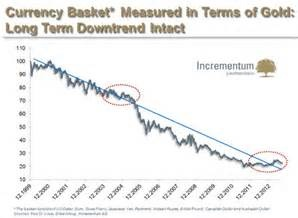
Can you see the truth? Even in this manipulated market? All fiat monies are in a negative trend moving toward zero even when priced in spot gold. The long-term trend in fiat money is negative because fiat money is designed to lose value over time, but you also need to recognize where we are in the trend cycle. And that’s where identifying the phases is helpful, though I contend, for a true “investor†the long-term trend is likely the most important.
How to Identify the Phases of a Trend
So now we know that fiat money is in a long-term negative trend with values nearing zero according to the bankers themselves. But how close are we to the end? That’s the question everyone asks. The answer lies in the phase of the trend.
Every trend takes place in three primary sentiment phases (see chart below); Accumulation, Awareness and Panic; thus named because of the prevailing attitude during each phase. Though there can be mini phases inside of the big phases, this graph illustrates those common emotions.
Technical patterns indicate trend evolution, ie cup formations, lower lows, higher highs etc.
Primary sentiment phases and technical patterns combined make it fairly easy to identify the phase of the trend.
Typically, the public participates in the bursting of a bubble, as seen in this chart. It’s one way they volunteer their wealth without knowing they’re doing so.
So take a good look at this pattern and let’s compare it to a recent full cycle trend in a fiat money product, the Nasdaq.

[Watch The Strategy Video Title: The Great Recession of 2008 Was Just A Warning!]

This is the Nasdaq from 1971 through the end of 2004. Doesn’t this look like the general trend cycle chart? OK then, how do you identify the sentiment of each phase?
The first psychological phase is the accumulation phase. This is the “dirt cheap†phase when smart money assumes positions after recognizing that the asset is fundamentally severely undervalued. The asset quietly goes up without too much attention being paid by Wall Street and the general public, and few people participate. It is typically visible through an accumulation pattern such as a “Cup Formation†and at a bottom you would likely hear black bearish negative sentiment from the general market. So even if you aren’t looking at a chart, you would hear people say things like, “I would never buy another tech stock again, it’s the worst thing I ever didâ€, but in fact, this is the best time to buy, that’s why the smart money is buying.
The second phase is the awareness phase, where seasoned professionals and a few more sophisticated funds take their positions. The general public begins to take notice and some people participate, driving prices higher at a little faster pace. This is also a more volatile phase, where we could see more substantial daily price swings. It is in the second phase where we can see some painful secondary corrections. Also known as the “Bear Trapâ€
In the third phase irrational valuations and behaviors along with a “this time is different†attitude is an easy way for the non-financial person to identify the final phase of any trend. Though most people get caught up in the euphoria of the extremes and irrational behavior can last longer than anyone could expect, the final phase always ends with a huge blow off.
Understanding that the third phase is irrational, let’s see if I can put the current fiat markets into perspective for you in a bottom line kind of way.
Fiat Money Markets
Think about what we’re being told today, how things are getting better, when they really are not. I believe we are now at the “Return to Normal†part of the third phase. Though all of the continued extraordinary tools and policies being used by the global central bankers should be enough to show you…things are NOT normal.
Globally, 60 trillion in new money has been added over the last 7 years. We’re told, and they keep telling us, that they are no longer doing QE. The chart below is from the Federal Reserve dated 4/29/15, and shows new money injected directly into the banks as the Fed buys derivative mortgage backed securities, which taxpayers are now responsible for.
Does it look like they’ve stopped to you? Plus, this is just one area of new money printing.
In addition, there are, at this writing, now 14 countries issuing debt with negative yields. So you are paying to loan those governments money. By the way, Poland just joined the negative yield club and they confiscated private retirement plans to reduce debt in 2013.

Generating inflation while depressing interest rates forces people into more risk, so you have stock markets making new highs at the same time the global economy is declining. In addition, because of these central bank actions, almost daily, we are being warned about the illiquidity in the markets and Janet Yellen, our current Fed Chair, keeps telling us the stock markets are overvalued. So when something happens that scares people and they want to sell? Too bad, so sad, that wealth is now locked in those markets. Think back to 2007, did you know the markets were going to freeze the moment that happened? The ITM army of precious metals consultants pays very close attention to the markets on a daily bases and WE didn’t know the second before it happened. Though we did know SOMEthing was going to happen, because technical indicators had told us several months before, just like indicators are telling us now. And you won’t know just before it happens this time either. But now, at least you know how to identify the trends and phases.
So thinking about those three charts I just showed you, and I could certainly show you lots more, do fiat markets seem extreme to you? Welcome to the third phase.
In terms of fiat currency life cycles, the blow off would translate in the hyperinflation and financial system reset that central bankers have been talking about. That lies in our future, but in our present it is well documented and openly admitted that central bankers are manipulating every market. Want the stock market to go up? Tell Wall Street that central banks will create new money and buy stocks with this new money. Want interest rates to go down? Tell Wall Street that central banks will buy all the new debt governments can create in order to push interest rates down. Want spot gold to go down? Just have banks sell lots of gold that does not nor ever will exist. I believe where the fiat markets are now is the return to normal part. And this is the quiet, just before the storm.
The normal non-financial person sees a rising stock market and thinks this is a good thing, and leaves their wealth in these extremely overvalued stock markets. They see interest rates at basically zero or even less these days, and take more risk for a little more yield not realizing they’re risking their principal in the process. If you lose your principal, how will you generate income? And by the way, that income is what helps you maintain your standard of living, so when people see spot gold drop, they stay away from physical gold and leave their wealth vulnerable. When did you decide to be a speculator instead of an investor? That is what fiat markets are these days.
At ITM we know the cure for the fiat money disease is good money gold. Therefore, it would make sense, particularly in these manipulated markets, that as the fiat money dies, gold could be used as an indicator of the fiat money trend evolution. So let me show you why I say that.
1st PHASE IS THE ACCUMULATION PHASE

Once Nixon took the US dollar completely off the gold standard, the central banks and governments began a campaign to treat gold like any other commodity. As such, spot gold was pretty much a mirror image of the stock market. These charts show the relationship between the Dow and Gold between 1996, at the beginning of the accumulation phase and 2004 when it concluded that pattern. This pattern is known as a cup formation because it kind of looks like the shape of a cup and indicates that smart money has begun their move. Therefore, gold began its current bull or positive market run.
As a fiat money trend indicator you can notice that, generally, when the Dow went up, gold went down and vice versa. On October 9, 2002 there was a shift in behavior which is also called a decoupling, whenever a decoupling happens, it is a signal of change and from there forward spot gold moved independently of the Dow. That was also the signal that the currency war between fiat currency (dollars, euro, yen etc.) and good money (gold and silver) had begun in earnest, but we were still in the first phase when nobody talked about gold, but the smart money accumulated quietly. In August 2004, the cup formation came to conclusion and we were off to the races! Can you see what’s actually called a handle breakout? The accumulation pattern is one of the most powerful patterns because it takes a long time to form and it shows you there is a very strong base built.
This is the pattern we’ll be looking for to tell us when it is time to begin to shift our wealth out of gold and into income producing assets.
2nd PHASE IS THE AWARENESS PHASE

This chart is a relative performance chart comparing some fiat monies vs spot gold from January 2000 through April 2006. Notice that when the dollar (blue line) went up, spot gold, the Euro and the Yen, moved down and vice versa. These moves were almost in lock step until June 9, 2005, when gold jumped and shifted its behavior against all fiat currencies. You might also notice that after the decoupling from stocks when gold began to retake its rightful position as a currency, it outperformed all of the other currencies in its move to behave independently of them. This was abnormal behavior at that time and a very strong indication of a decoupling or shift. That shift told us we were moving out of the first phase and into the second, awareness phase. With more participation, trading volume increases in the second phase.
SPOT GOLD DECOUPLES FROM PHYSICAL GOLD

This graph shows ultra-rarity coins, which go for perhaps hundreds of thousands to millions of dollars per coin and represent big money buying in the physical only market. In addition, central banks bought the second largest amount of physical gold in 2014 than they did over the past 50 years. That’s what the smart money knows, but spot gold is what the people see and it takes little effort to create as much as banks need to in order to control the visible price. And so we have the most current decoupling, spot gold decouples from physical gold. It may only be at the ultra-rare levels at this point, but that will change, perhaps by the end of this year when China opens its new physical gold exchange denominated in Renminbi.
You might have noticed that that black bearish sentiment around gold is happening now too. That’s because a rising gold price is an indication of a failing fiat currency, and so spot gold has been manipulated down to hide this from the people. Which indicates to me we are in the bear trap of the second phase.
In addition, as central banks and others in the know continue to accumulate as much physical gold as quickly as possible, central bankers and Wall Street’s denunciations have made gold hated, which is what creates your opportunity.
Logic tells you that in a free market, when demand exceeds supply, prices should go up, but a rising gold price indicates a failing currency and if you understood the dollar was failing, is it possible you’d choose to hold your wealth in gold?
At the same time, fiat money products like stocks and bonds have been manipulated to extreme valuations and illogical unsustainable bubble levels.
The third phase in gold lies ahead of us. This is when gold will move near it’s true value, which is many times higher than where spot gold is today. But this decoupling between the computer spot gold and the tangible physical gold, to me, indicated that the shift from the second to the third and final phase of the fiat money trend was in process. It took more than a year to conclude the shift. Since it began in January 2013, we are over 2 years in.
The fiat markets are currently under the control of the central banks, but for how long? No one knows, but you now know we are in the third and final phase of the fiat money trend. What choices will you make based upon this knowledge?
[Watch The Strategy Video Title: The Great Recession of 2008 Was Just A Warning!]
Trends In Summary
If you can master the basics of how to identify the long-term trend and where we are in the trend cycle, no one will be able to pull the wool over your eyes. Without one doubt in my mind and for all the reasons I’ve shown you, we are in the third and final phase of the fiat currency lifecycle. If we were still in the 1st or 2nd phase, you’d have some time, but I believe we’re not, I believe we’re in the final phase and warnings are coming faster and more frequent. The global currency wars are heating up, the rapid rise of the dollar vs other currencies is unprecedented and may now be disintegrating. What will the central bankers do to counter that?
There are some things that you can do today to protect and grow your wealth. Let’s look at the action items.
The first thing you want to do is an assessment. How is your wealth currently positioned? I cannot tell you how many people do not understand that stocks and bonds aren’t real but are fiat money instruments. They are. If in doubt, call your precious metals consultant to set up a time for review.
The most conservative choice is to reduce counterparty risk as much as possible and make sure you are the legal owner of your wealth.
Finally, believe trend and hard evidence that you saw today, we’re happy to send you links so you can do your own due diligence. Central Banks will do their best to save the banks, that’s their job. Your job is to be a good steward of your wealth. If you hold your wealth in illiquid fiat markets, take it back while you still can. Raise cash and finish your strategy position.
We’ve also put together links to research material used in today’s webinar, so make sure to call your ITM Precious Metals Consultant at 888-696-4653 for those links or with any questions you may have, we are all here to be of service.