TREASURY YIELDS HEADED FOR RECESSION: All Time Lows & Loss of Control

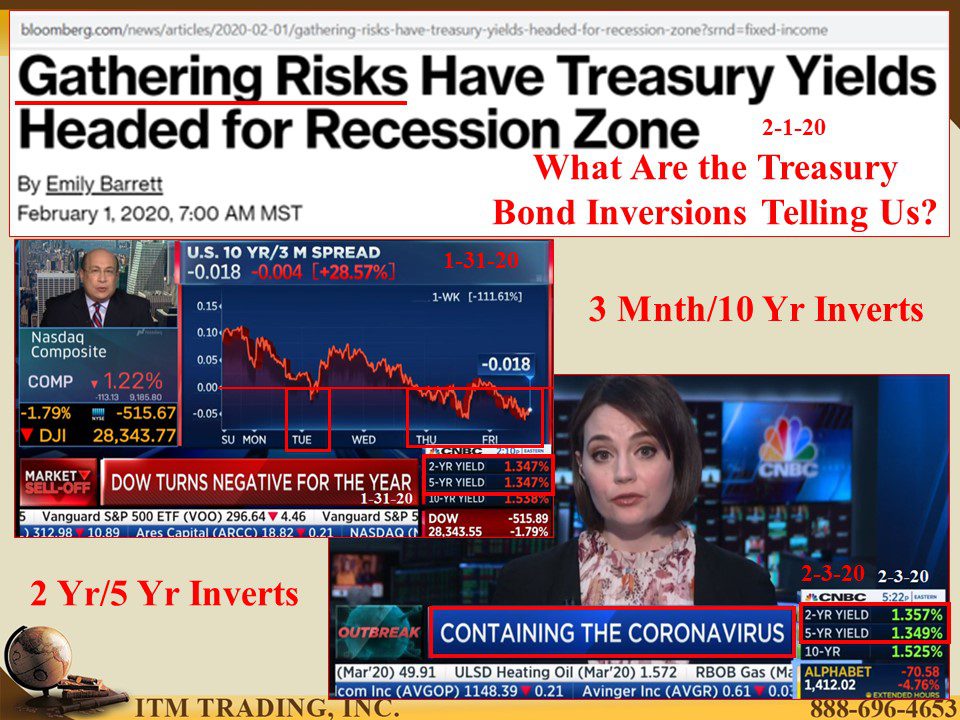
Thanks to the Fed’s “not†QE buying of short-term treasuries that began on August 21, 2019, the Fed’s key recession indicator, 3-month treasury yields vs 10-year treasury yields, were forcefully pushed out of inversion on October 11, 2019. But it didn’t last.
On January 31, 2020 the 10-year and 3-month yields inverted again. As a reminder, an inverted yield curve is when the shorter-term rates are higher than longer term rates. Thus, you will be paid more to loan money to the government for three months, than you will be to loan them money for 10-years.
Additionally, on February 3rd the 2-year treasury yield rose above the 5 year treasury yield.
Why? Because of the possible impact of the coronavirus on the global economy. But frankly, it runs much deeper than that. This retest of inversions that began on December 4, 2018 are telling us that the Fed is losing control as are all central bankers.
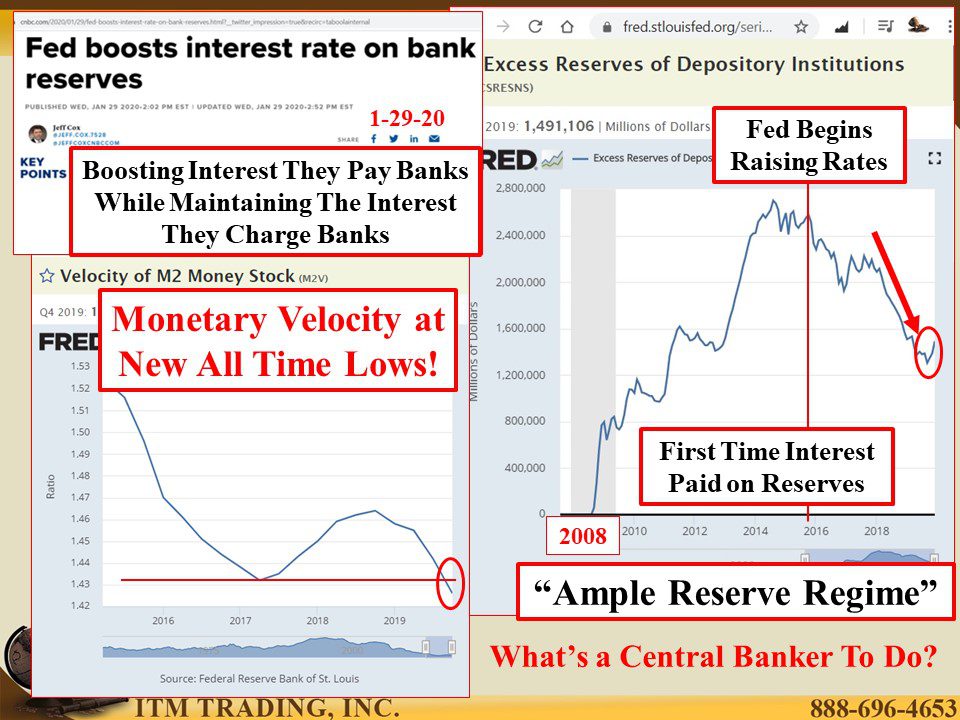
The problem is that, the ability to profitably stimulate the economy via debt, peaked in Q3 1997, as witnessed by the Fed’s monetary velocity chart that shows the speed of spending. Monetary velocity is now making new historic lows, significantly lower than the “Great Depression†when most people didn’t have any money to spend.
But wait, haven’t the global central banks been on a new money creation tear since 2008? They call that “stimulus†but new lows in monetary velocity show the lack of economic stimulus, though stock, real estate and bond bubbles show where all that new money has gone, primarily into the hands of the elites, those closest to the central bankers.
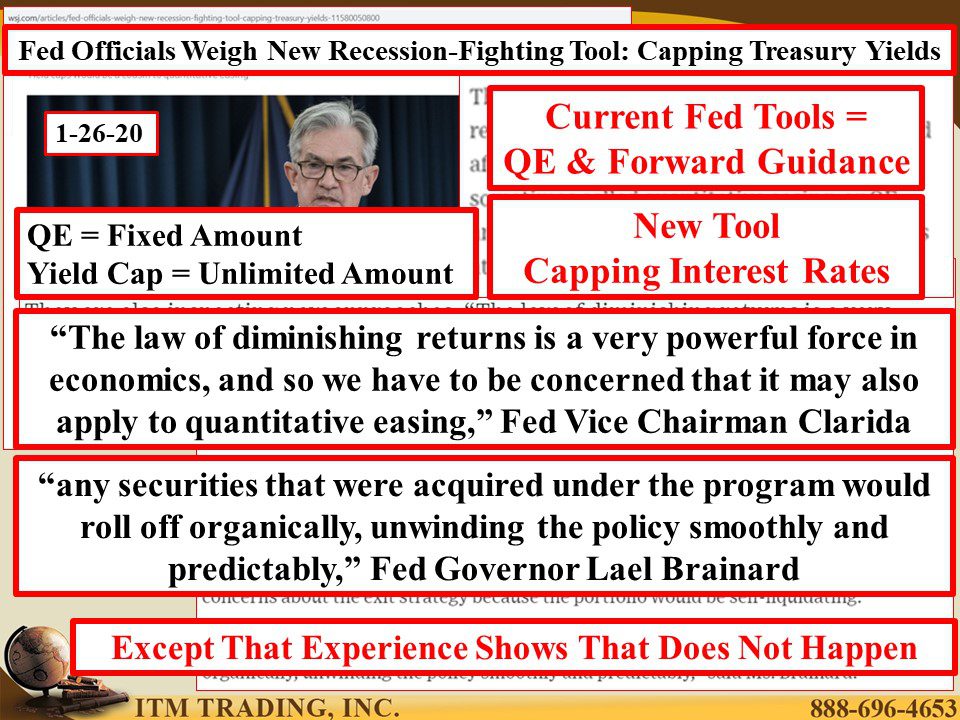
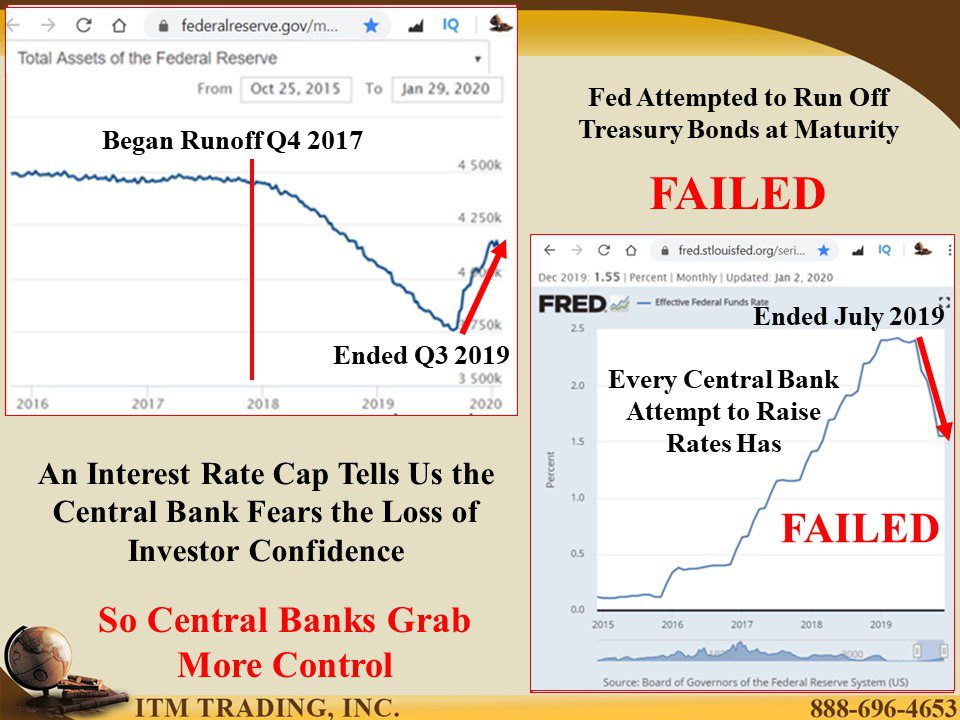
What happens when an abuser begins to lose control? They attempt to grab even more control. Central bankers are no different and their traditional tools no longer work, which forces even greater experimentation, in an attempt to remain in control. Good thing there is a leader in fiscal experimentation…Japan.
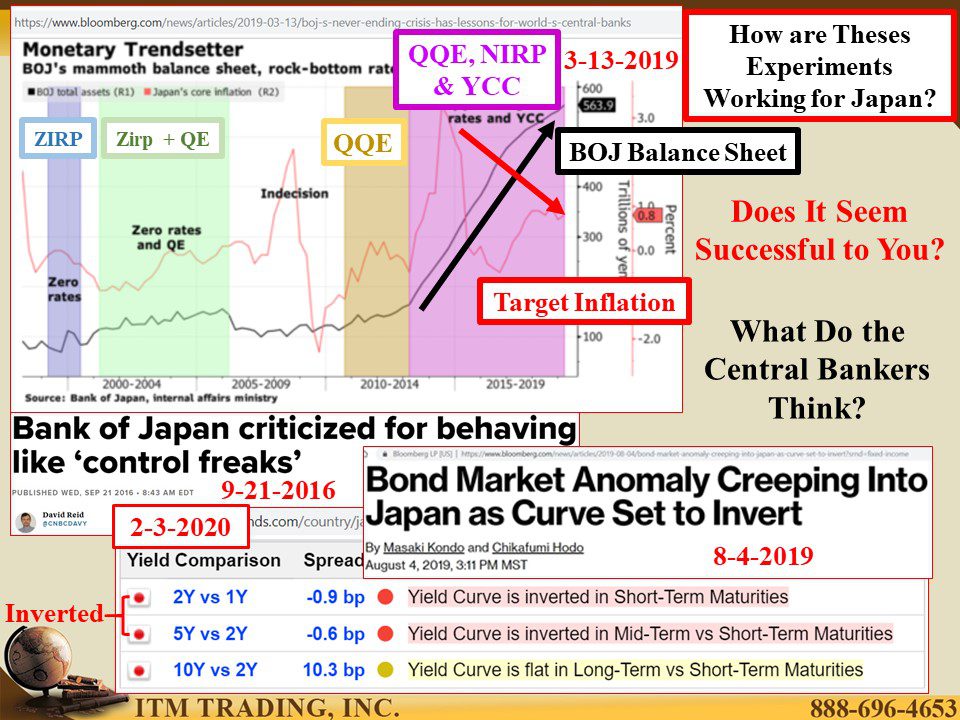
Japan has been fighting the deflation battle since the early 1990’s. First with ZIRP (Zero Interest Rate Policy) then adding QE (Debt Based Money Printing). When the global financial crisis hit in 2008, their programs expanded again with QQE (Qualitative and Quantitative Easing) and in 2016 the BOJ pushed the hyper drive and their balance sheet exploded.
Of course, negative interest rates are attached to all this new debt. As another reminder, negative interest rates mean that lenders pay borrowers, instead of the normal, borrowers paying lenders. Negative rates, imposed by central bankers (the borrowers), enable a higher level of debt growth as it reduces the cost of servicing that debt.
What will happen when interest rates rise? That will be catastrophic to the massive bond market because it wouldn’t just impact the cost of new debt, it would impact the value of all debt in the banks, pensions, ETFs, mutual funds etc. Everyone will know the emperor has no cloths and confidence in the central bankers and governments will be lost. And in any Ponzi scheme, confidence is everything.
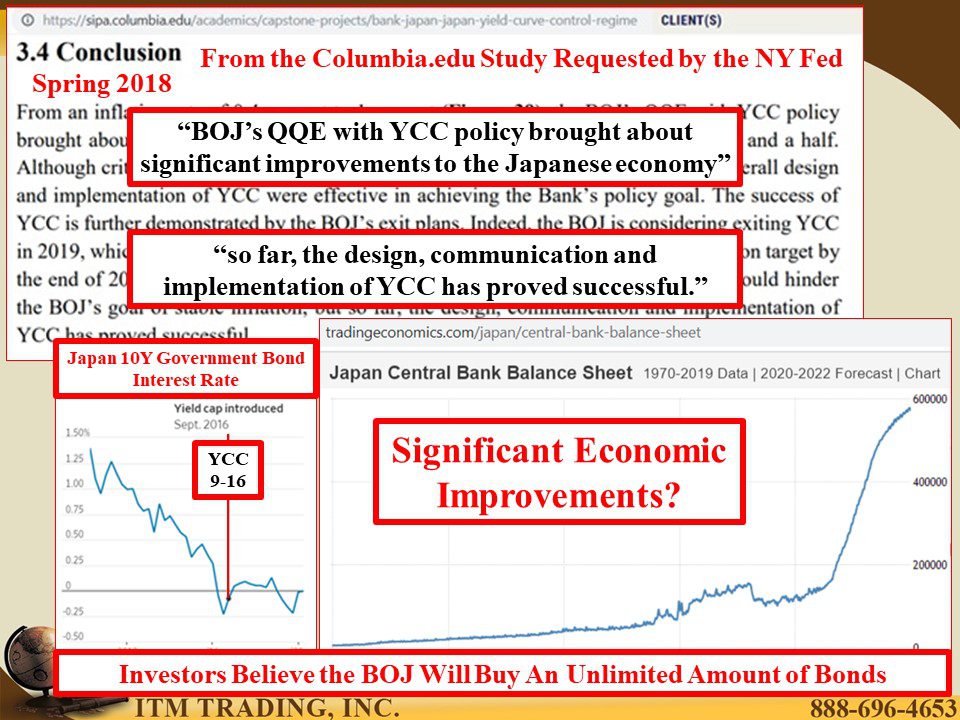
In September 2016, the BOJ instituted YCC (Yield Curve Control) by vowing to buy back an unlimited amount of government debt to CAP rates at 0%. Easy to do that when you control the printing press. Additionally, one look at the stratospheric rise in the BOJ balance sheet shows they really mean it.
A 2018 study by Columbia.edu and authorized by the New York Federal Reserve deems this experiment a success. I suppose it depends on how you define success. It has, so far, been successful on maintaining interest rates near zero. Additionally, the BOJ has been able to slow the pace of purchases. But the report also concluded that “BOJ’s QQE with YCC policy brought about significant improvements to the Japanese economyâ€. Has it?
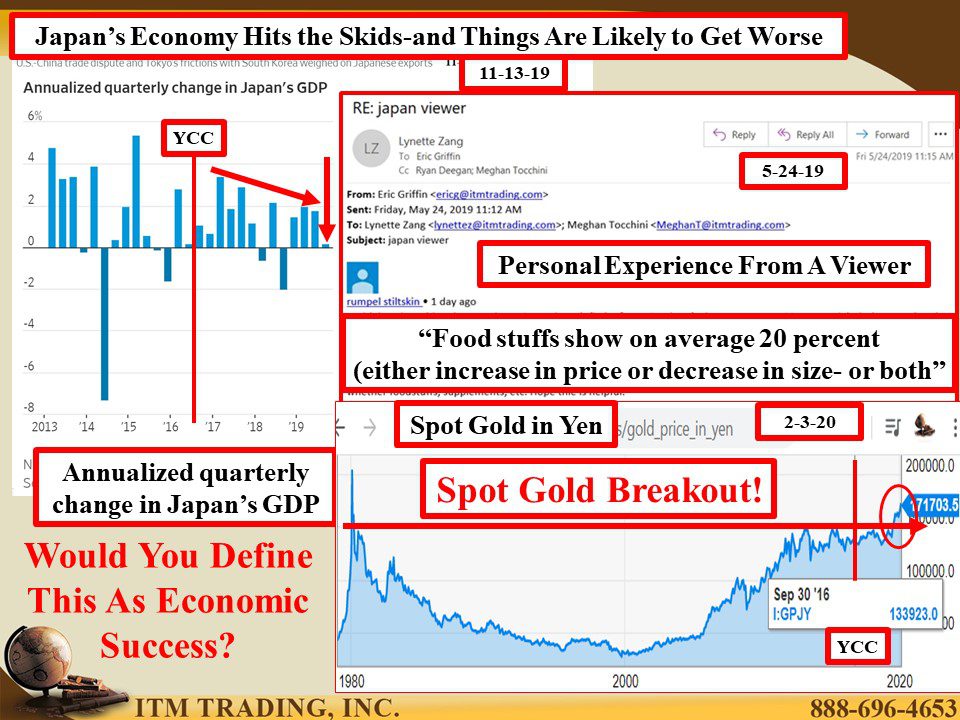
A Wall Street Journal headline published on November 13, 2019 shouts “Japan’s Economy Hits the Skids and Things Are Likely to Get Worse†as they show the GDP contraction in Q3 2019, despite the banks swollen balance sheet. Their banks are being chocked by negative rates and their citizens are being pummeled by tax increases and real inflation.
Of course, none of that matters to central bankers’ intent on keeping control as long as possible. My bet is YCC with Negative Yields in the US during the next crisis. They have to. The Fed failed in their attempt to reduce their balance sheet and raise interest rates, which shows you who is really in control…wall street. And Wall Street LOVES free money. Melt-up anyone?
What about gold? Spot gold in terms of Japanese Yen just concluded a major cup formation (key accumulation pattern) that began in March 1980! The next step would be the 203,368.4 billion yen all-time top established in January 1980. At this writing, with spot gold at 171,703.5 billion yen and the BOJ committed to printing the yen into oblivion can a new spot gold high be far off?
- https://www.bloomberg.com/news/articles/2020-02-01/gathering-risks-have-treasury-yields-headed-for-recession-zone?srnd=fixed-income
- https://www.cnbc.com/2020/01/29/fed-boosts-interest-rate-on-bank-reserves.html?__twitter_impression=true&recirc=taboolainternal
- https://www.wsj.com/articles/fed-officials-weigh-new-recession-fighting-tool-capping-treasury-yields-11580050800
- https://www.federalreserve.gov/monetarypolicy/bst_recenttrends.htm
https://fred.stlouisfed.org/series/T10Y3M
- https://www.bloomberg.com/news/articles/2019-03-13/boj-s-never-ending-crisis-has-lessons-for-world-s-central-banks
https://www.bloomberg.com/news/articles/2019-08-04/bond-market-anomaly-creeping-into-japan-as-curve-set-to-invert
http://www.worldgovernmentbonds.com/country/japan/
- https://fred.stlouisfed.org/series/JPNASSETS
https://sipa.columbia.edu/academics/capstone-projects/bank-japan-japan-yield-curve-control-regime
https://tradingeconomics.com/japan/central-bank-balance-sheet
- https://www.worldforexrates.com/xau/jpy/1-exchange-rate/
https://ycharts.com/indicators/gold_price_in_yen
https://www.wsj.com/articles/japans-economy-grew-less-than-expected-in-third-quarter-11573691974