Stocks and Inflation

ITM Trading America’s Trusted Source for Precious Metals since 1995
Finding ITM Trading Online
Website – https://www.ITMTrading.com
Shop for gold and silver online https://www.itmtrading.com/buy-gold-and-silver-online
YouTube – https://www.youtube.com/user/itmtrading
FaceBook – https://www.facebook.com/ITMTrading/
Twitter – https://twitter.com/ITMTrading
To learn more about the benefits of gold please call us at 1-888-own-gold and ask for a free gold kit. Or you can order your free gold information kit online by clicking this link http://bit.ly/2bIjYOI
YouTube Video Transcription
Hello everybody I am Lynette Zang cheif market analyst here at itm trading a full-service physical precious metals brokerage house.
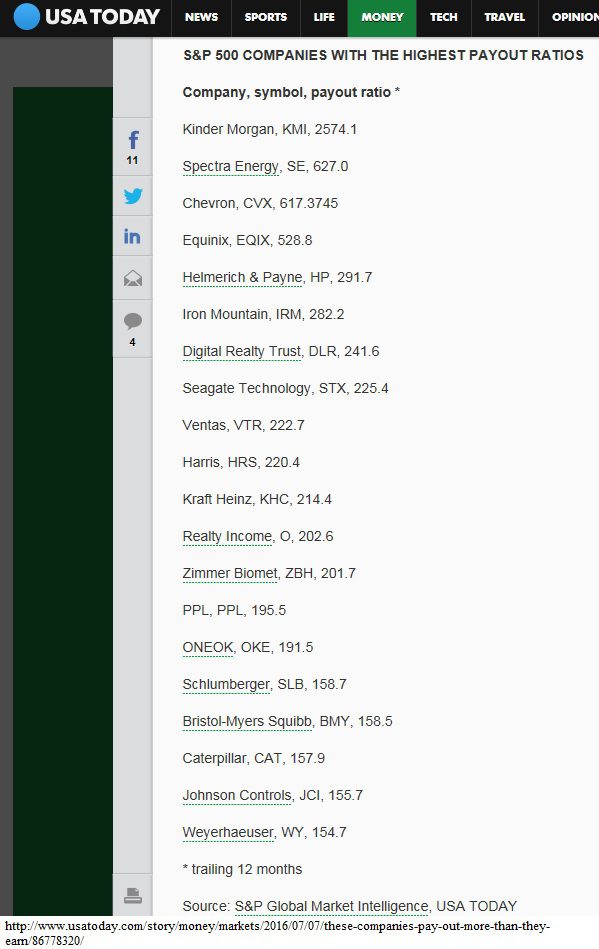
Last week we talked about bonds and inflation this week we’re going to talk about stocks and inflation and why they are so important for them to for the stock market to hide the erosion of purchasing power so first you’re looking at the cumulative inflation chart and you can see how that saw an exponential once we went completely off the gold standard ok now i want to compute inflation since nineteen thirteen while actually for and that persisted with this one without was and remember there are links below so you can see these images and jpeg form ok now this shows you the same thing just a little differently but what I wanted a particularly point out was the time when we had of money standard shift because that were already in the process of that so you could see this one which is where we shifted for a bowl standards to the beginning of the fiat money standards and then you can also see looking at it backwards this one ok this area in here seventies during the early eighties where we shifted from a fiat money of full of kind of gold fiat money standard to cure see out money center so can you see the rate of inflation one we shifted ok that’s important for you to recognize as well so the first one was cumulative alright now we’re going to talk about stocks etc so i pulled up this wonderful graph on who i’m going to say actually think they own stock and what you should be able to see from this is a very strong transition problem ownership outside a retirement plan and to ownership inside a retirement plan so really much of what we are looking at here that’s where the normal person holds their wealth IRA k or 401k etc pre-tax dollars in this system now if the stock market you get your statement and you open it up and statement looks ok then you think well everything must be ok.
Stocks and Inflation
There are many many reasons why they needed to look okay now in this particular graph it shows you your real rate of interest this is inflation and then these are the taxes that you pay you can see that those go up as well even on the dividend and then look at this lovely line here the fees so remember we talked about that nominal confusion piece what you’re looking at is the stock market going up and you’re thinking oh are doing well but in reality when you take into account all these different taxes and inflation etc you’re not doing very well at all but Wall Street is because those seas are guaranteed your returns are not guaranteed and it is simply your perception that you own something when you have your money position inside of the stock market it is actually according to yell off study this is you down here you’re the beneficial owner the legal registered owner if you have something like that yeah if you have something inside of a brokerage insurance banks etc if you don’t hold it you know own it it’s just your perception and your the beneficial owner but all these guys between dtc your season company and you are also beneficial owners and they get to use any equity inside of those accounts for their own benefit they can borrow against it and then do anything they want with the money that’s called hypothec a shin and you can see from this bar chart how much particularly JP Morgan Morgan Stanley cetera how much they use your equity for their benefit is a big part of their trading revenue and the revenues but you also need to understand about it is that they can do it if they if they create this contract through the city of London which is where most of them are done there are no limits to how many times that same equity can be used and that’s called three hypothecated that’s all about leverage ok on top of that you can see it is derivative graph and you guys have probably seen this before she’s been watching the webinars how much they can create brand-new speculative products from the rise in the stock market and in fact this one is from the office of the controller of the currency and it’s just showing you derivatives against equity and look at where we are they generate an awful lot of money by borrowing your equity and then leveraging it and making bets against it which is what makes it so vulnerable any wealth held inside of this fictitious fiat money system that’s what makes it vulnerable and I hope that you can see this so now I’m a little confusion right you see the stock market what it looks like I’m starting out that days in a row get me wrong with your right how about that of those games but what I want to point out is over here they’re right there long-term capital management that was the first speculative derivative bubble so it’s derivative so they pushed the nasdaq up and look what happened to that speculative bubble when it first this one is for so you see that we are at extreme level with a ton of correlation I mean all of those graphs pretty much look alike but this technically speaking this is what’s happening with official inflation and you can see all right now here we go Oh wedge formation you can think of it like a piece of pie where you have your broader at the back and then you go narrow so what we see in these inflation numbers are away formation occurring at some point this will and a wedge formation i don’t care what charter looking at you’ll see a series of higher lows and lower high which is exactly what we see here at some point this breaks out if it breaks out as a wedge formation breaks out to the upside and that means it’s going to keep going up if it breaks out to the downside and its most likely to keep going down technically but we finally had of officially two-and-a-half percent inflation and they’re thinking this is a really good thing is they keep control of it which they can and that’s not really what the intention is anyway then I’ll just keep it at a rate that you don’t notice i continue to use all of those tools for nominal confusion where you’re looking at a number but you’re not understanding evaluation of the dollar underneath so I hope that helped clarify why they want inflation and why inflation is good for the central bank’s the government and certainly all of the other banks and just go ahead and subscribe to our YouTube will let you know what we’re doing these live events like us on Facebook follow us on twitter and give the call and then also the links won’t be up until Monday building out here for weeks up today ok so they’ll be up on monday and also let you know that you’re going to see more charts in there and i’ll probably do that from here forward anyway of on charts that i didn’t use but that I pulled so until next time be safe this weekend bye-bye.