HOW CLOSE IS THE NEXT CRISIS: The Patterns Are Telling… by Lynette Zang
Mixed messages and confusion are the norm these days. We’re told that even though the rest of the world is slowing, here in the US we’re doing great thanks to consumer spending. Except that in December, retail sales plummeted, including online sales. Washington and Wall Street want you to believe that this is just a fluke and even though all sorts of recession signals are screaming, they don’t see that in the cards…yet.
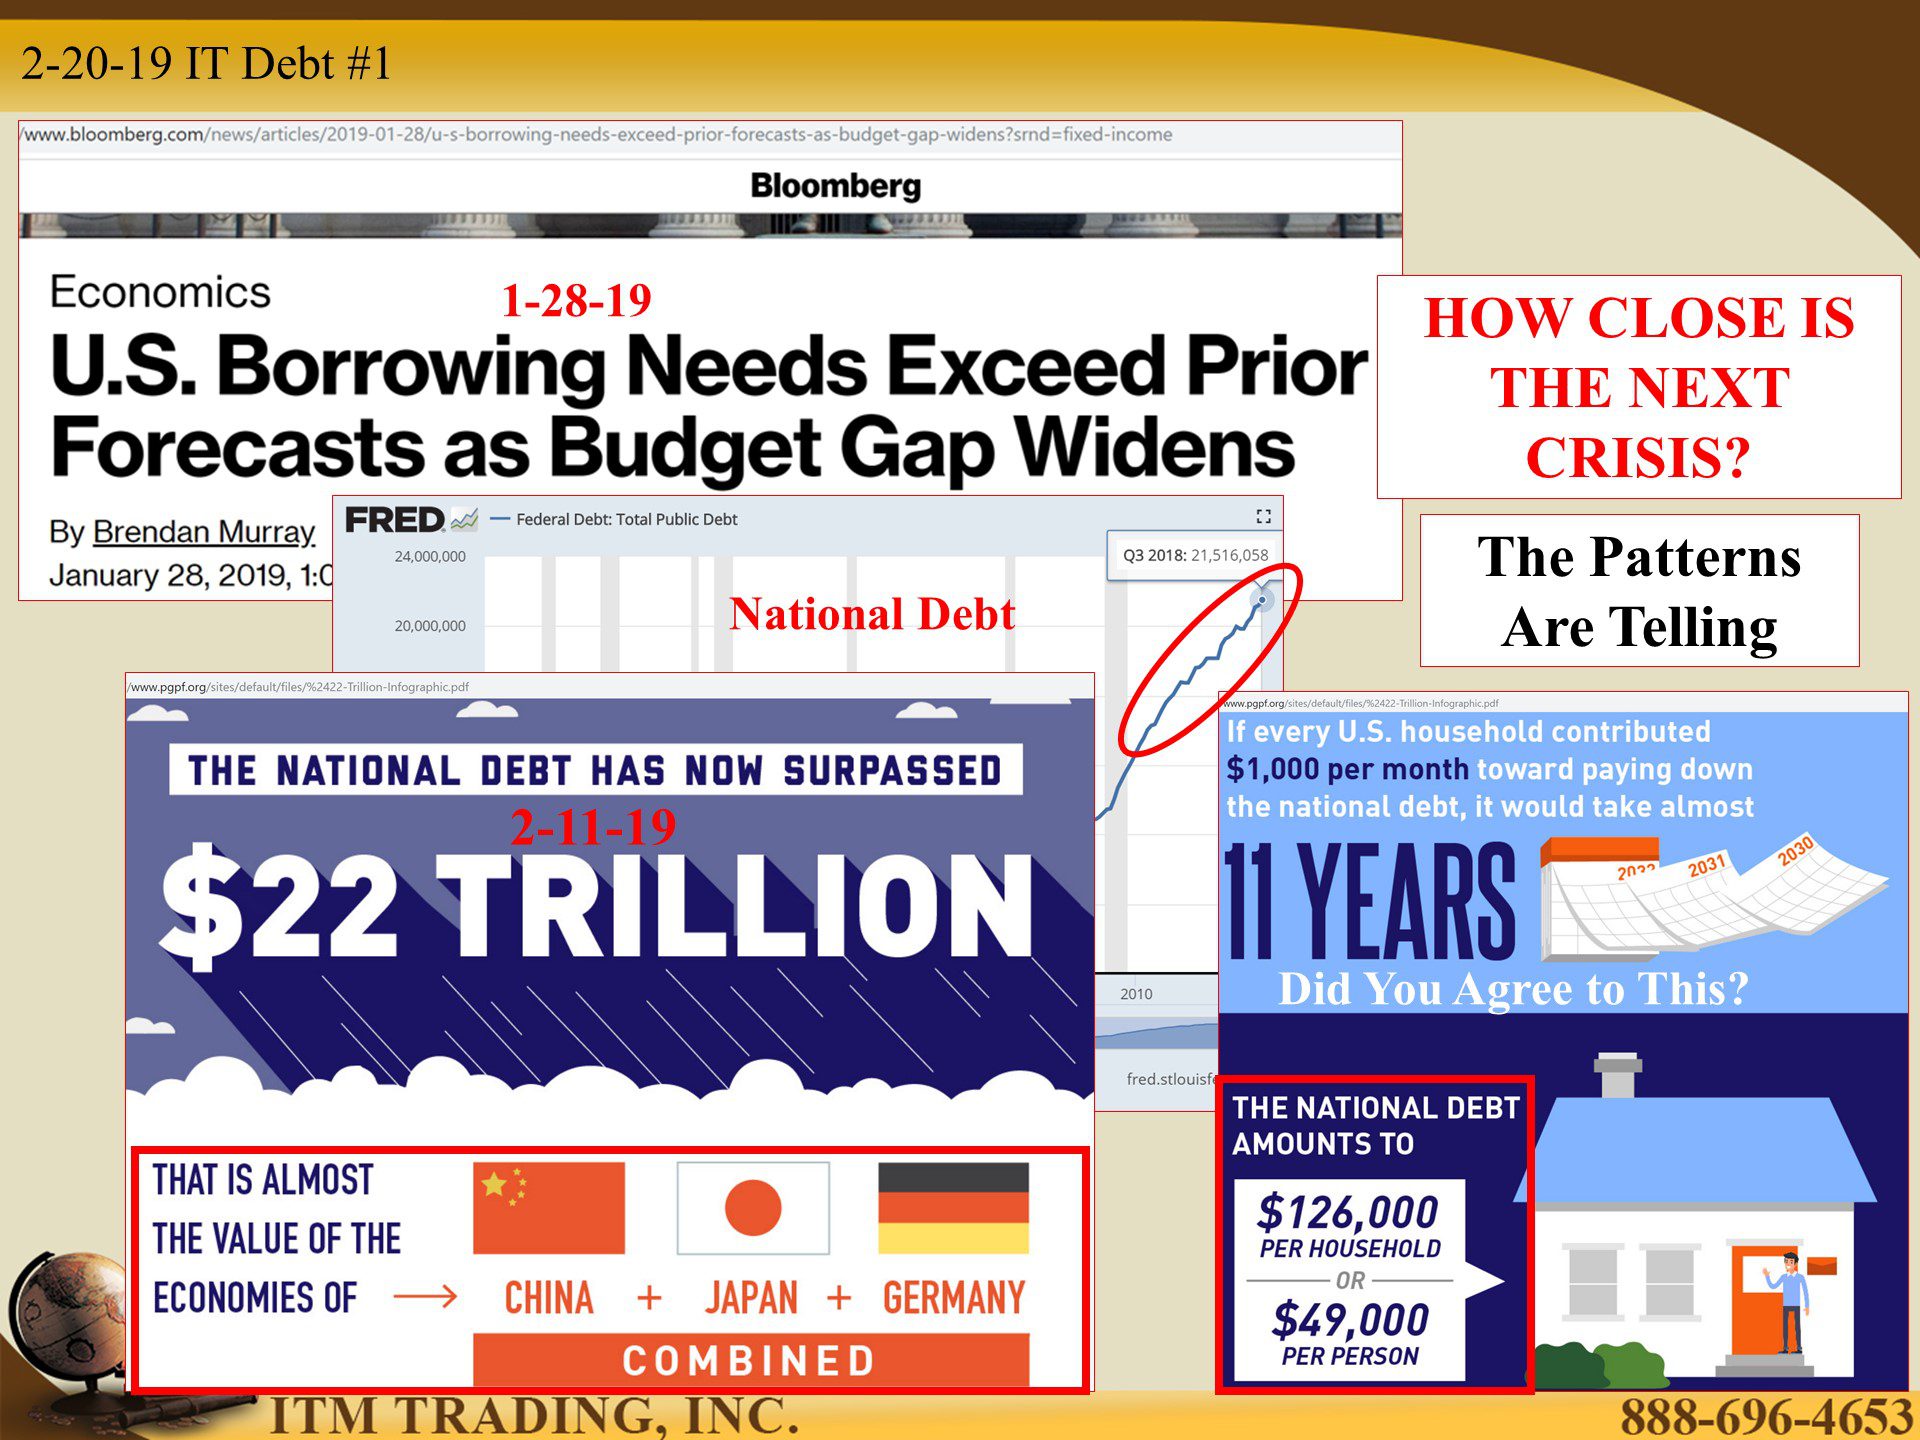
I suppose if central banks can backstop government and corporate spending, markets in terms of fiat, can continue up. But there are some problems with this scenario and the debt wall looms large.
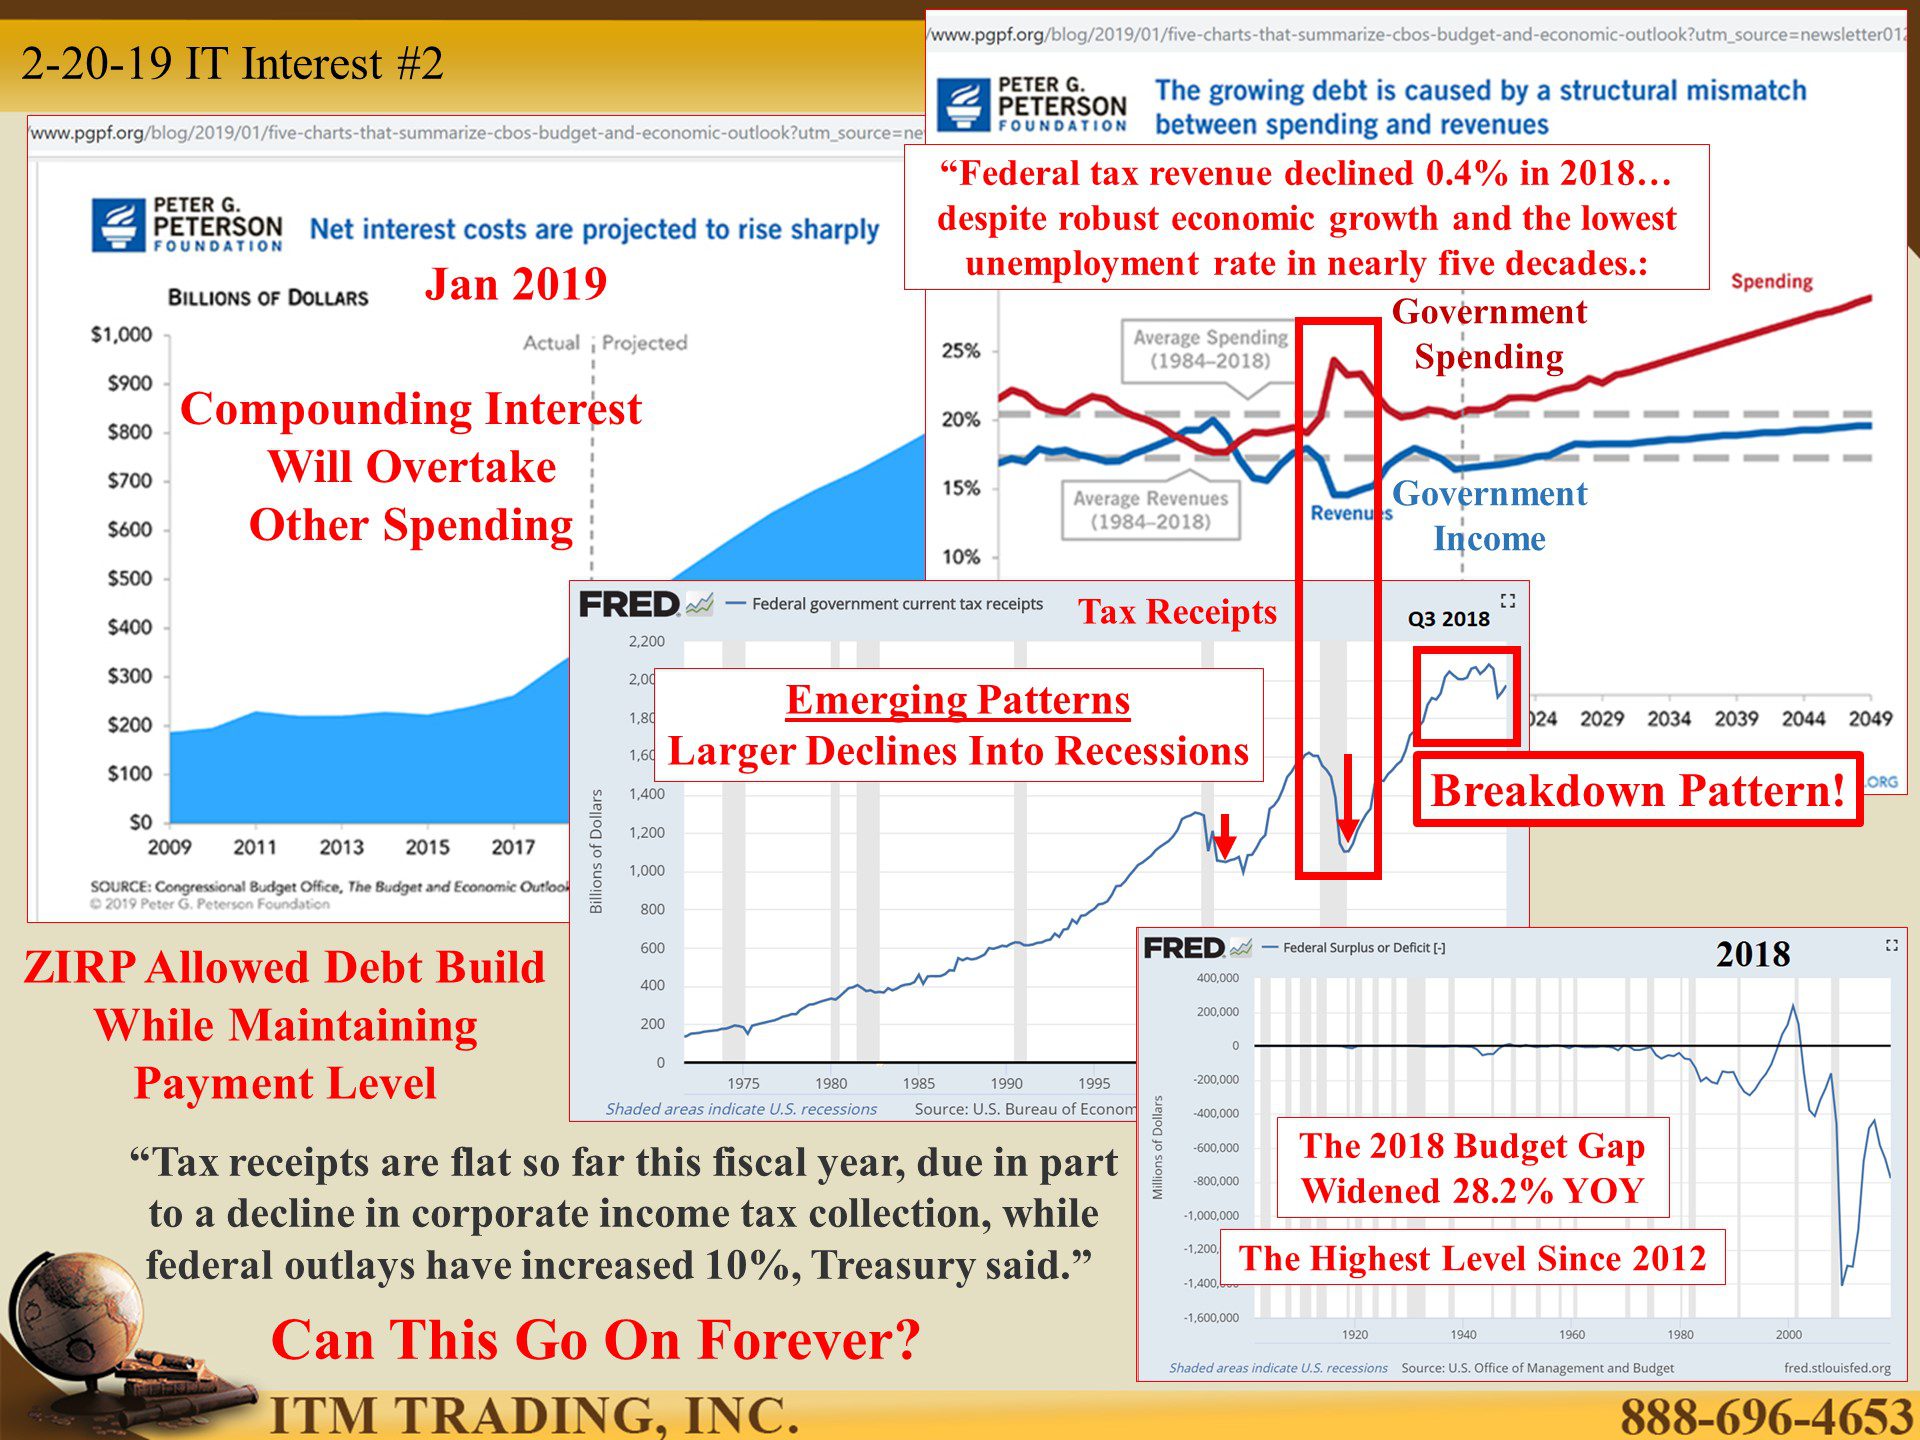
On February 11, 2019 the United States Public Debt hit $22 trillion. That amounts to $126,000 per household, though that does not consider entitlements, like Social Security, Medicare or Underfunded government pensions. So the debt burden is really a lot worse. But the problem is a structural mismatch between spending more money than they have coming in through tax revenues; and the recent tax reform didn’t make that issue any better.
The Peter G. Peterson Foundation did a projection showing how spending would increase faster than income over time, but they did not take into consideration the emerging patterns of government spending vs. income during recessions. Nor did they discuss the current escalation of the debt breakdown pattern occurring right now, which is causing global deflation, when what central bankers want is inflation.
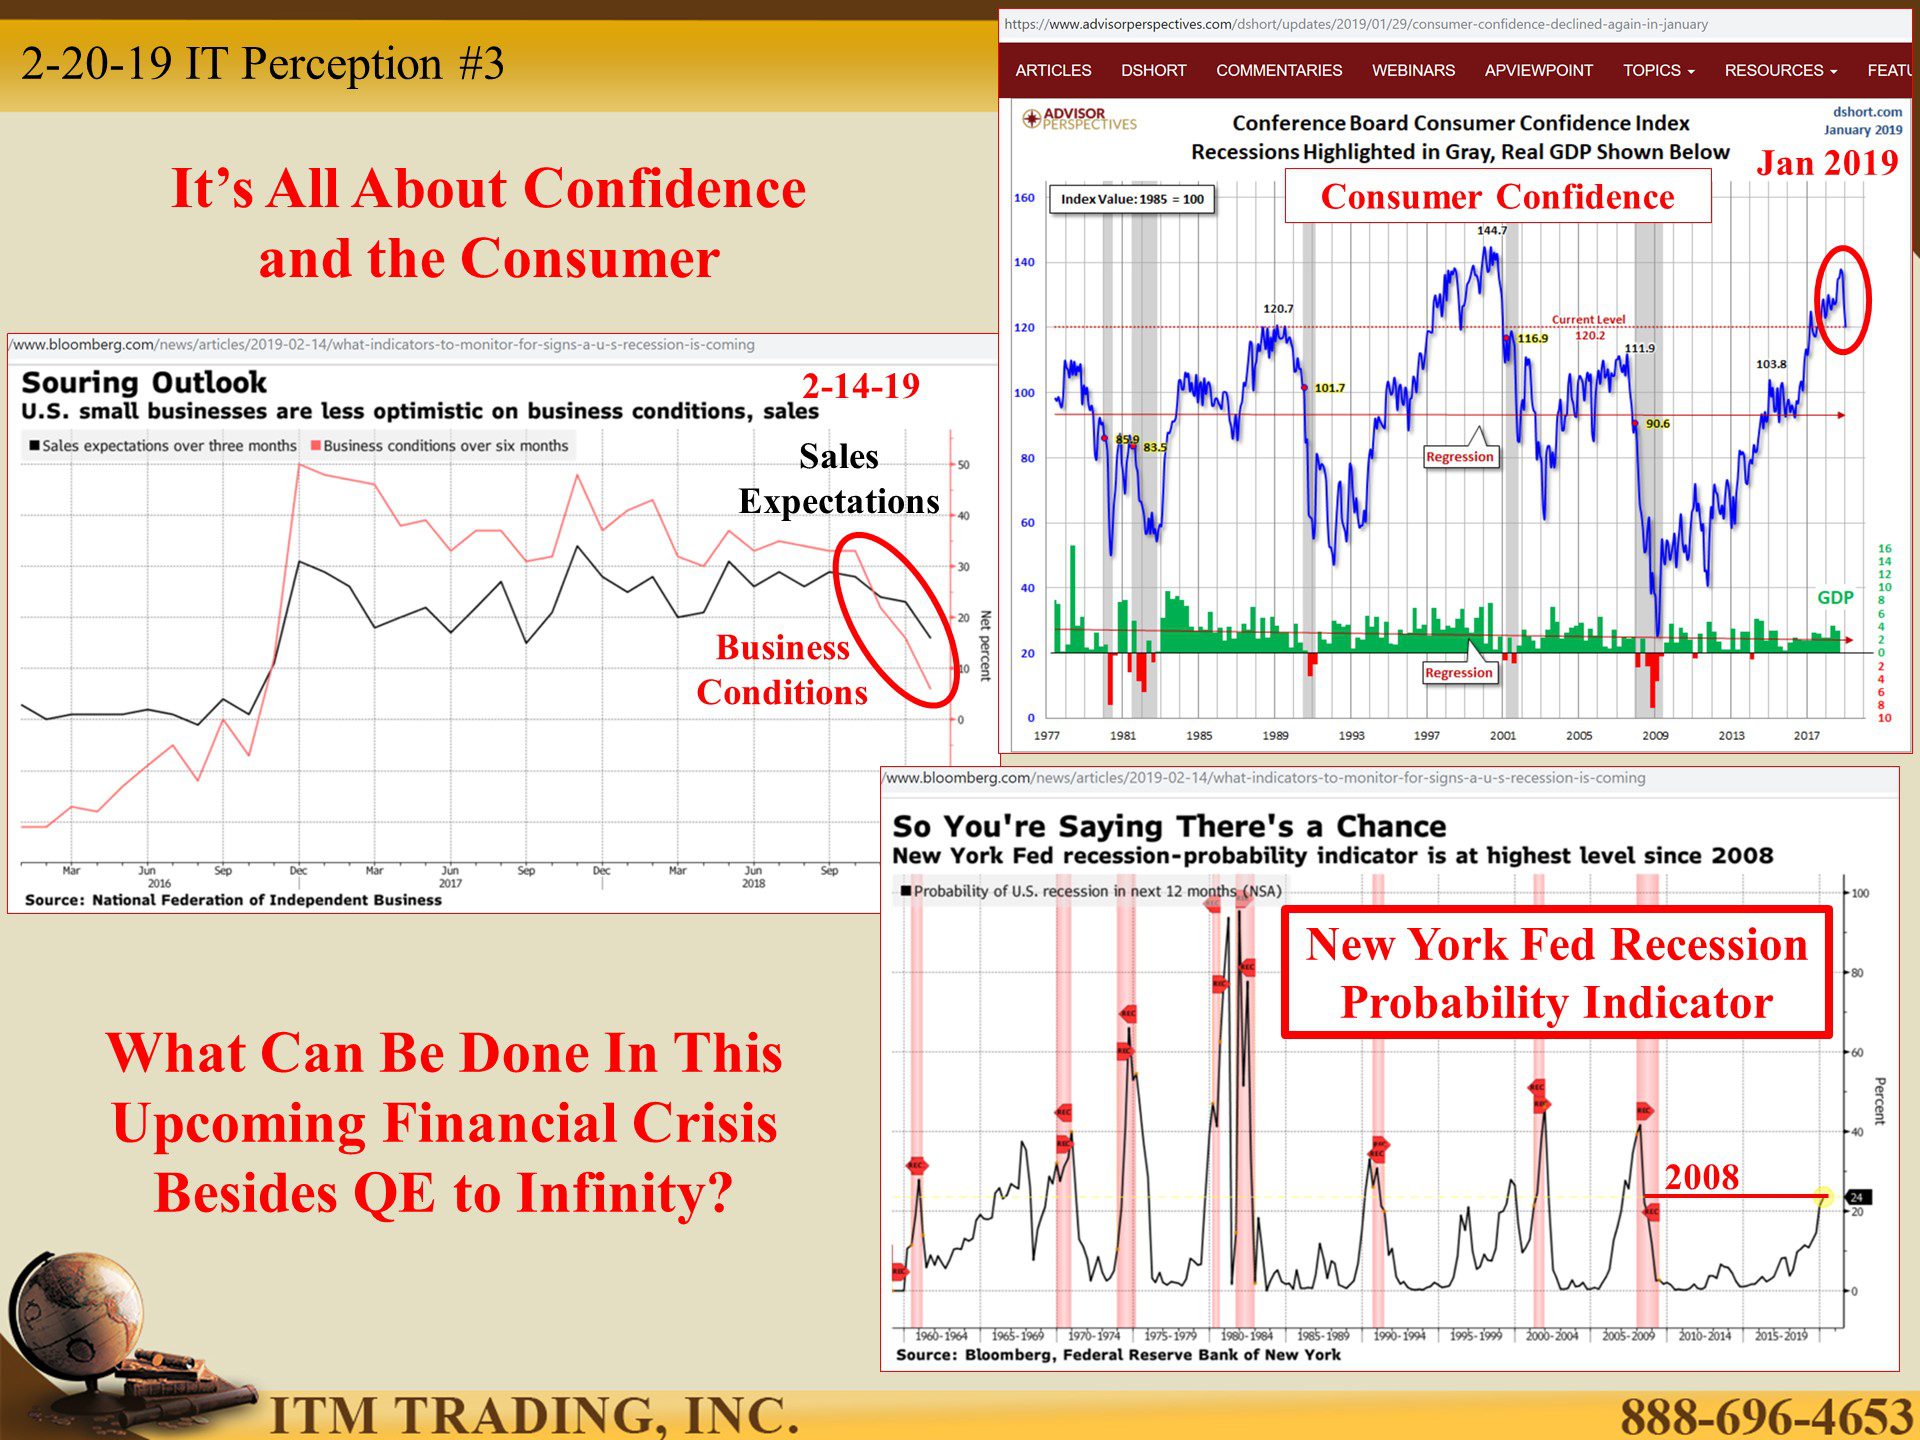
The capex spending anticipated from the tax law changes did not materialize, though some wage inflation has. So as usual, the heavy lifting is left to small business and consumers. Uh oh, confidence seems to be slipping. In addition, the New York Fed’s recession probability indicator is now at the highest level since 2008. Perhaps we aren’t doing as well as they’d like you to think.
In March of 2018 a critical Fed recession signal was first breached, and then the yield curve inversion began in December 2018, the recession may be much closer than the elites want you to understand.
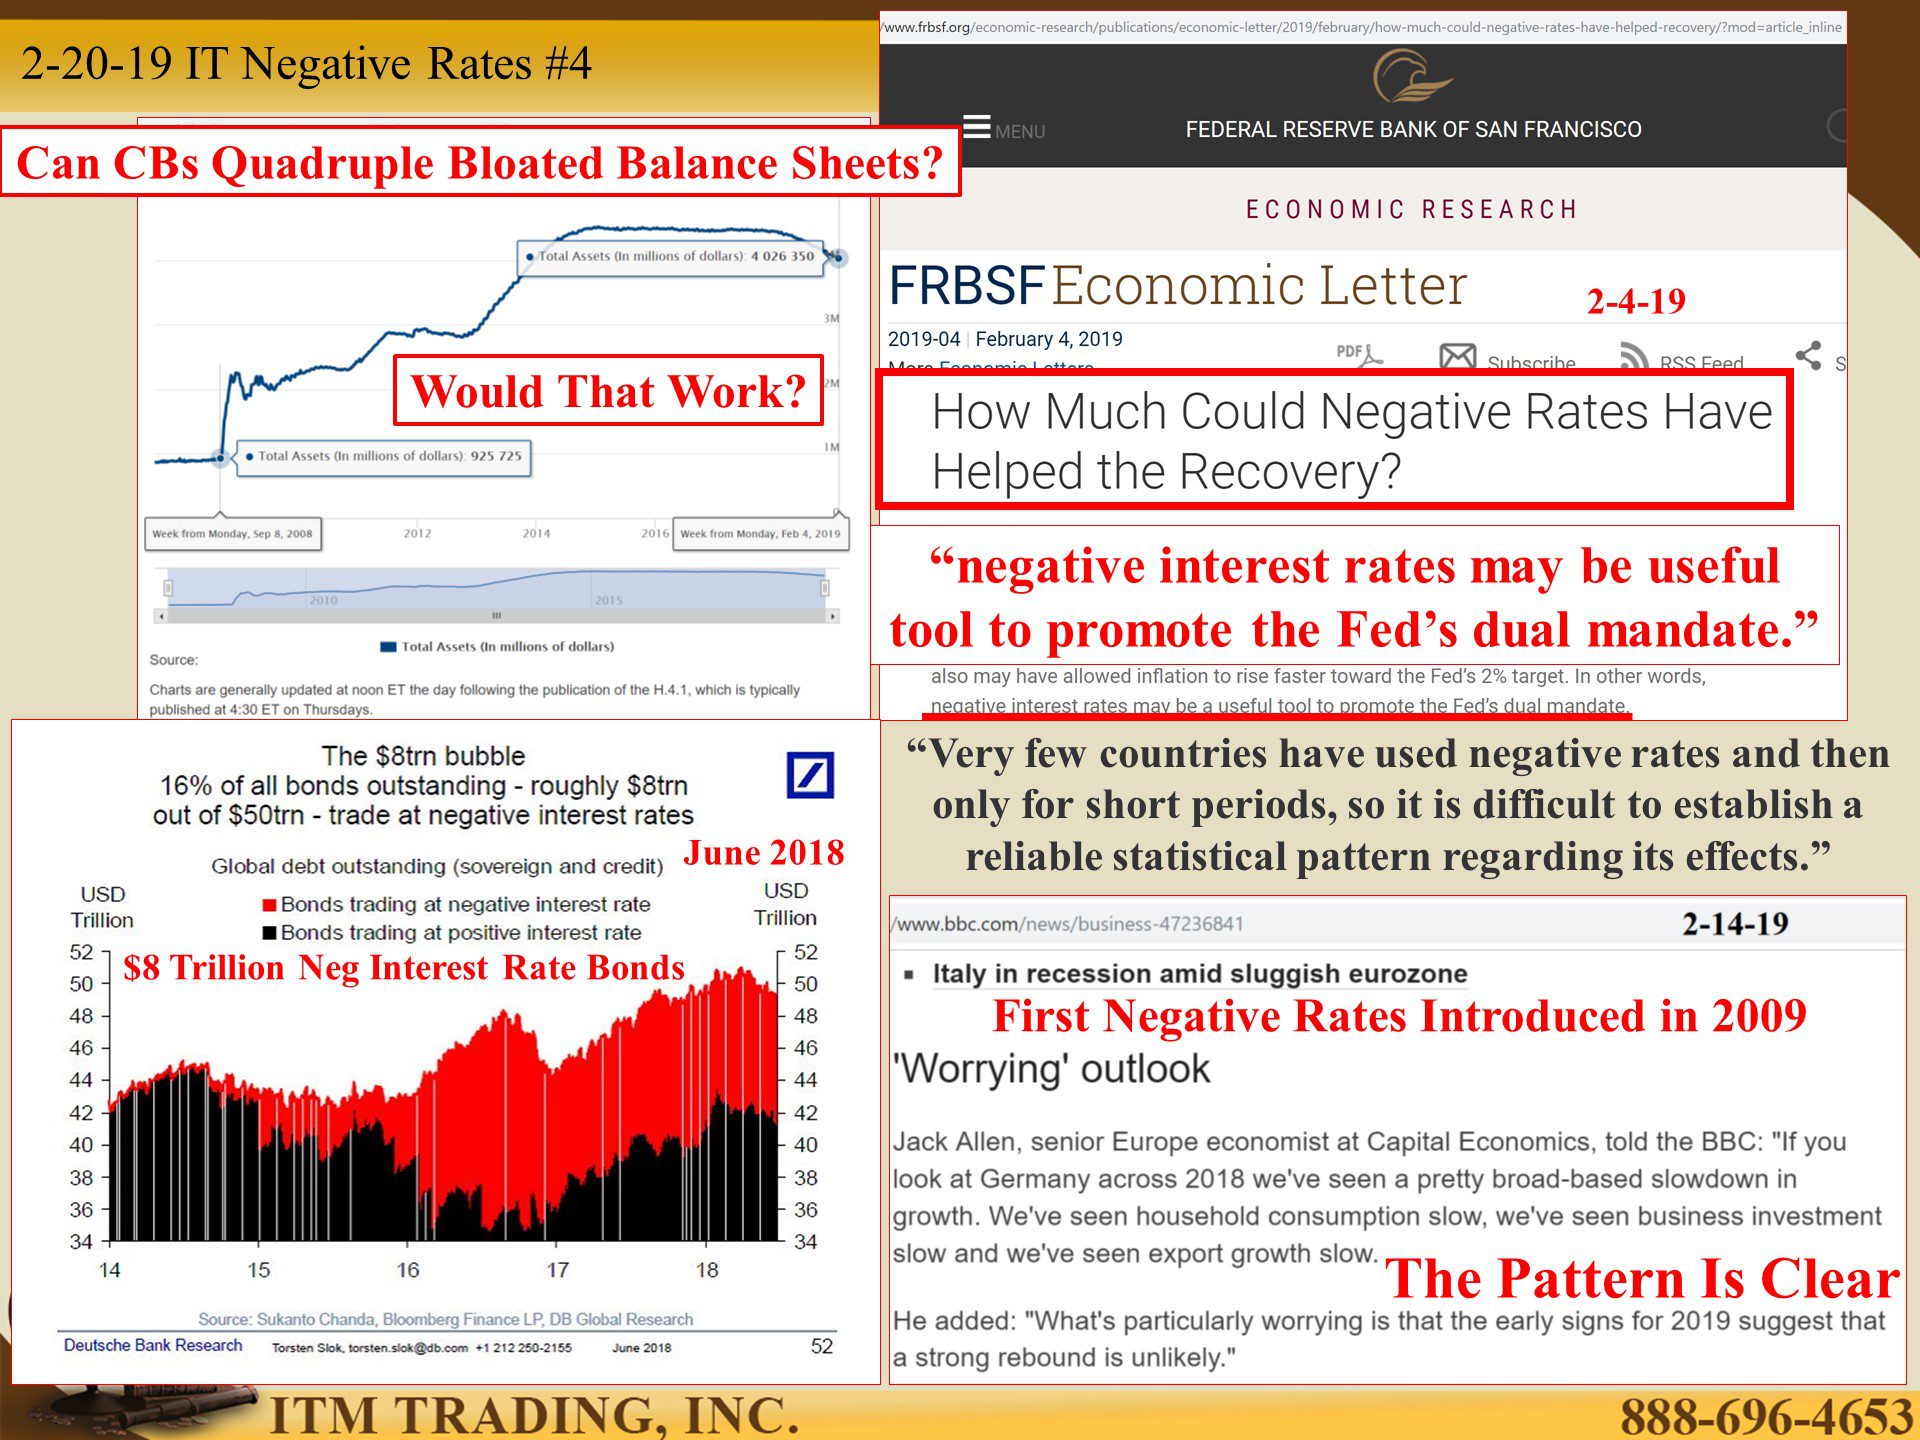
And what is the most likely outcome? Certainly, more QE money for free policies. But in a recent research report from the San Francisco Fed, it proposes negative rates as a “useful tool to promote the Fed’s dual mandate.†The author states that “Very few countries have used negative rates and then only for short periods, so it is difficult to establish a reliable statistical pattern regarding its effects.†So the author created an economic model as a better indicator than the experience garnered since 2009 when Sweden first instituted negative rates. As of this writing, they still have them.
In fact, there are over $8 trillion, or 16% of all outstanding bonds with negative rates, most on European and Japanese government bonds. Has that “stimulated†their economies? No, but since the Federal Reserve has been unable to raise rates to more “normal†levels, they know negative rates will most likely be the global blueprint. Which means that the next recession/financial crisis will see a full blown attack on principal.
So here’s the pattern that repeats. Once a central bank crosses a taboo boundary (QE, Negative Rates, using central bank balance sheets etc.) it becomes the standard. But there are other patterns occurring now too.
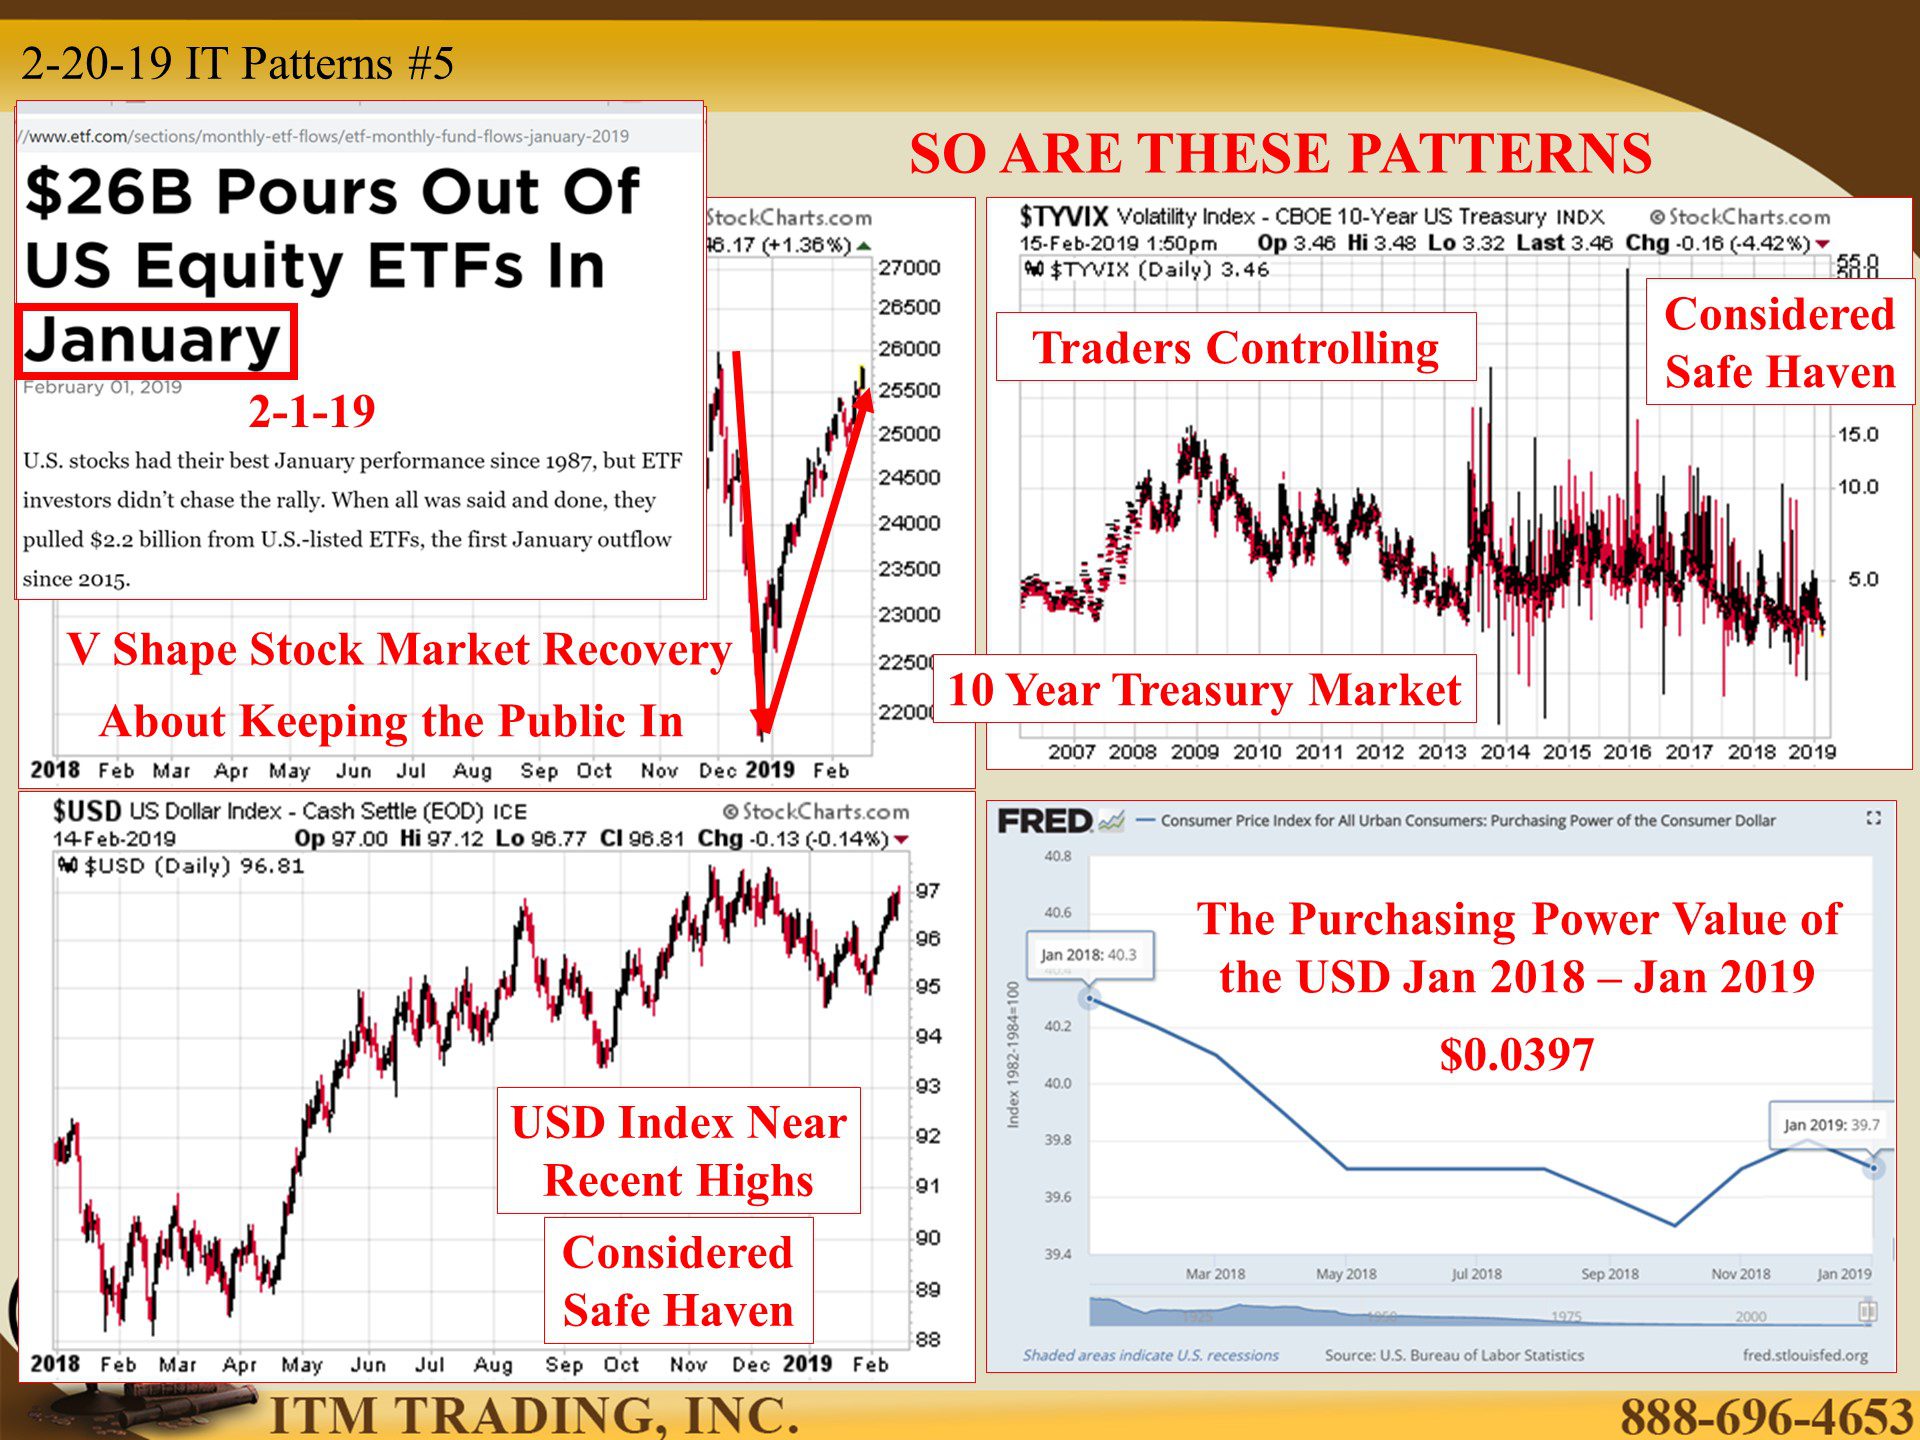
Like the V shaped recovery of the stock markets since the Federal Reserve caved to market pressures. A V shape recovery is not stable and could come down as fast as it went up. How about the pattern expressed by wall street traders as they took over the US Treasury market (which is supposed to be a safe haven) or the myth of a “strong†dollar as inflation robs the fiat currency of all purchasing power value.
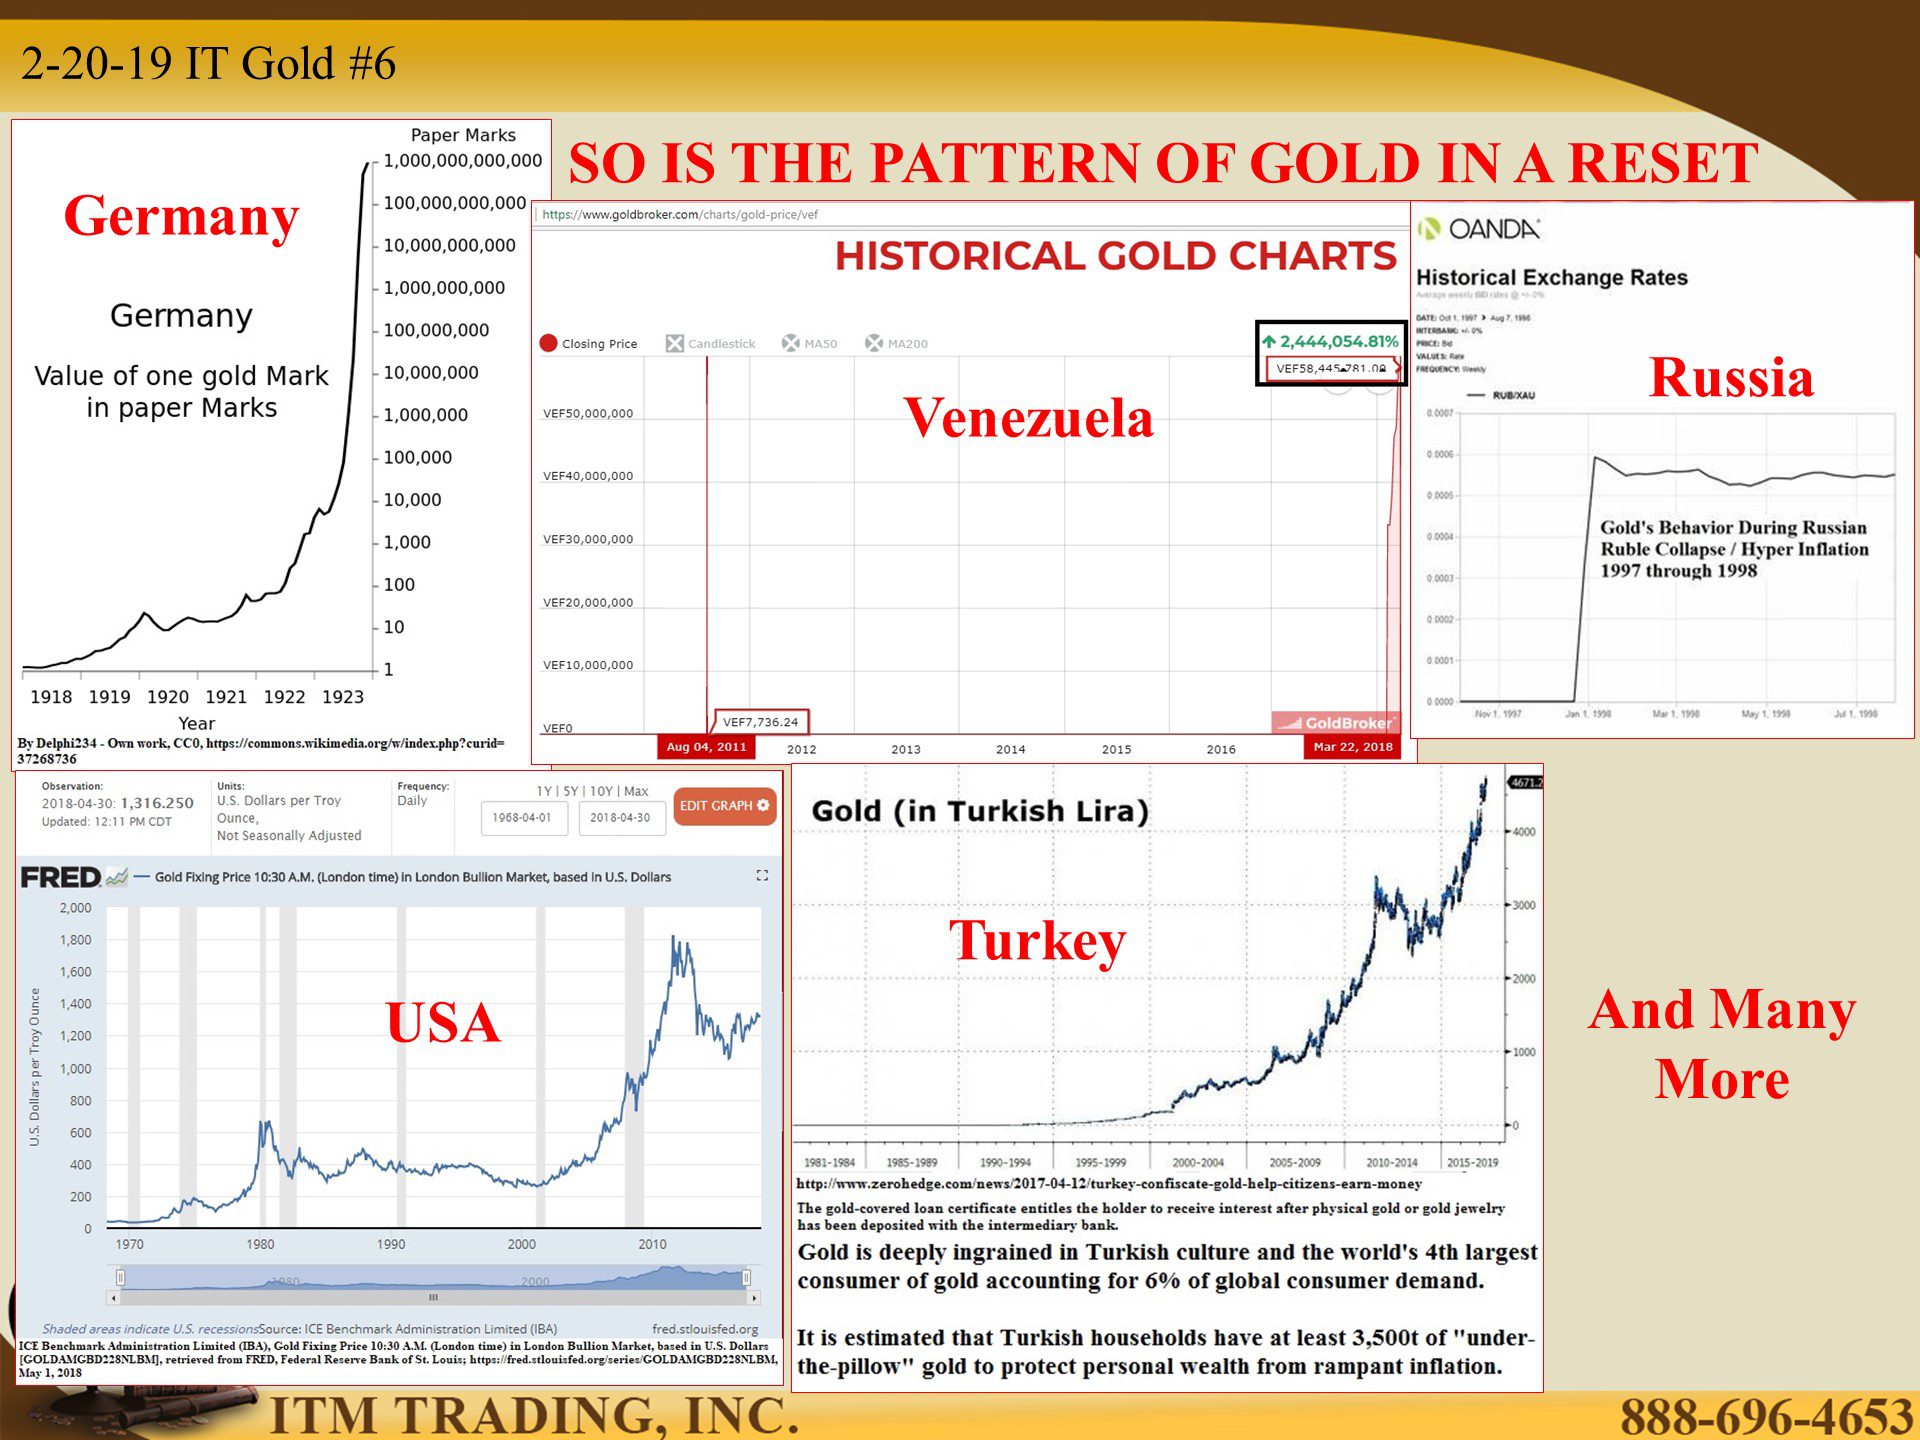
Of course a key historic pattern is what happens to gold during a reset. Better get some now while you can.
Slide and Links:
https://fred.stlouisfed.org/series/FYFSD
https://www.pgpf.org/sites/default/files/%2422-Trillion-Infographic.pdf
https://www.pgpf.org/sites/default/files/%2422-Trillion-Infographic.pdf
https://fred.stlouisfed.org/series/W006RC1Q027SBEA
https://www.wsj.com/articles/u-s-tax-revenue-declined-0-4-in-2018-11550084426
https://fred.stlouisfed.org/series/GFDEBTN?cid=5
https://www.federalreserve.gov/monetarypolicy/bst_recenttrends.htm
https://twitter.com/dlacalle_ia/status/1012724860911603712
https://www.bbc.com/news/business-47236841
https://www.stockcharts.com/h-sc/uihttps://fred.stlouisfed.org/series/CUUR0000SA0R
https://www.etf.com/sections/monthly-etf-flows/etf-monthly-fund-flows-january-2019
YouTube Short Description:
Once a central bank crosses a taboo boundary (QE, Negative Rates, using central bank balance sheets etc.) it becomes the standard. But there are other patterns occurring now too.
Like the V shaped recovery of the stock markets since the Federal Reserve caved to market pressures. A V shape recovery is not stable and could come down as fast as it went up. How about the pattern expressed by wall street traders as they took over the US Treasury market (which is supposed to be a safe haven) or the myth of a “strong†dollar as inflation robs the fiat currency of all purchasing power value.
Of course a key historic pattern is what happens to gold during a reset. Better get some now while you can.