BUFFETT’S ALARM: Market Valuations Explode Past GDP as Collapse Nears
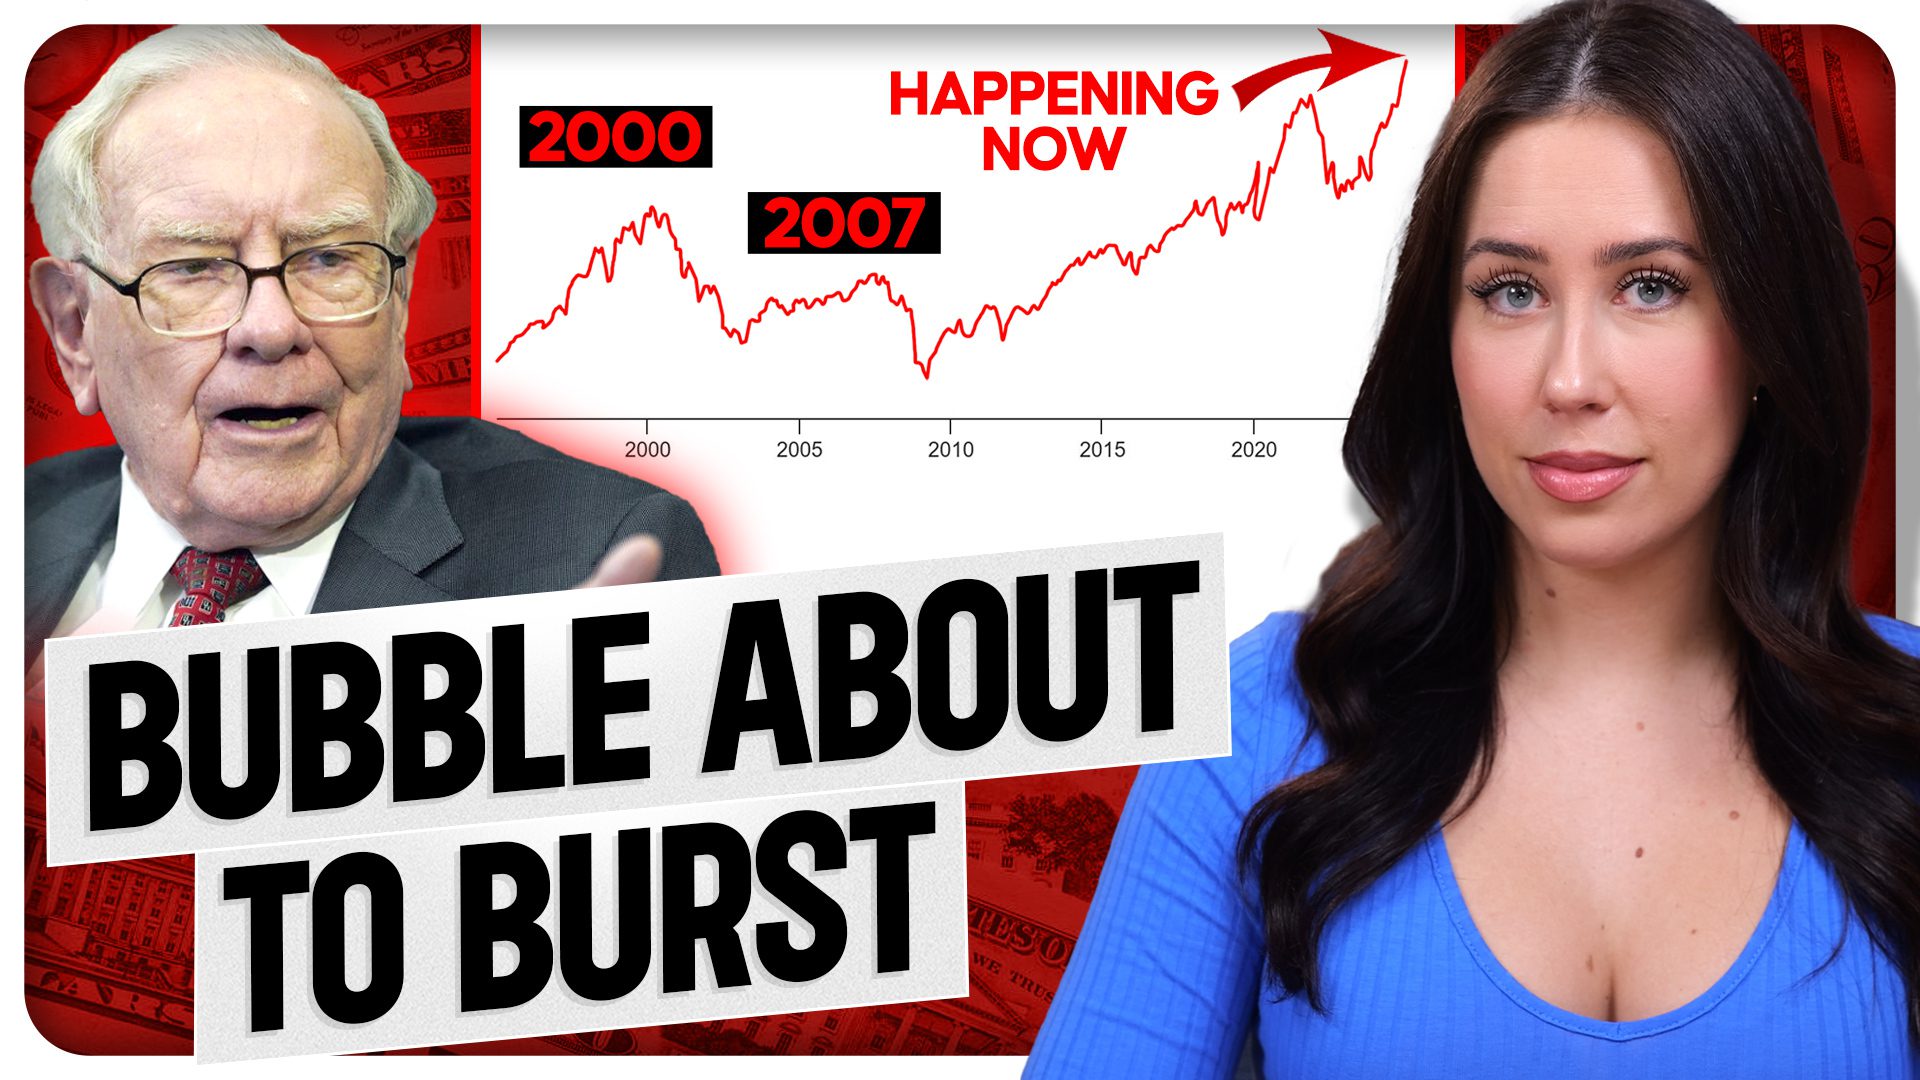
The stock market has never been more overvalued, as the Buffett Indicator soars to a staggering 200%, double what it was during the dot-com bubble. This everything bubble signals that a painful crash is imminent, with fallout expected to ripple through the economy. Learn how to protect yourself and your wealth before it’s too late.
CHAPTERS:
00:00 – The most overvalued market in history
00:39 – What is the Buffett Indicator?
01:56 – Comparing today to 2008 and 2000
02:37 – What’s driving the bubble?
05:23 – Years of low interest rates fueling unsustainable growth
08:26 – The fallout of a bursting bubble
10:01 – How to protect your wealth before it’s too late
11:40 – Final thoughts and getting your strategy in place
TRANSCRIPT:
00:00
We are currently experiencing the most overvalued stock market in history, as valuations on the Buffett Indicator—a tool proven to show when the market is overvalued before a crash—continue to reach alarming new levels. Far exceeding anything we saw during the 2008 Great Financial Crisis or the dot-com bubble, it signals that the everything bubble we’re in is finally ready to burst.
But it doesn’t just signal how close we are to the bubble popping; it also tells us just how painful it’s going to be.
00:39
What exactly is this indicator, what is it telling us right now, and how can you use this information to protect yourself? Let’s get into it.
The Buffett Indicator, named after its inventor, Berkshire Hathaway CEO and legendary investor Warren Buffett, compares the market capitalization of stocks to GDP to determine whether they’re over or undervalued.
01:12
We’re looking at the Wilshire 5000, the total value of all publicly traded stocks, compared to GDP. Anytime this ratio is high—over 100%—the market is considered overvalued. Under 100% would indicate undervaluation.
01:56
Today, we are at 200%. For context, in 2007, right before the housing bubble burst, we were at 110%. During the dot-com bubble in 2000, we were at 130%. Today, we’re double that, at 200%.
This ratio compares the total economic output of the country (GDP) to the valuation of stocks. When stock valuations are double the country’s economic output, it’s a sign of unsustainable and unrealistic growth.
02:37
You might wonder: what’s driving these valuations so high? There are three big factors:
- Market Concentration
Right now, a small handful of tech giants are disproportionately inflating the entire market. This level of concentration hasn’t been seen since the 1970s, a period of extreme inflation.
03:44
2. Speculation
Speculation has convinced people that this growth is the “new normal.” People are draining their savings and retirement accounts to invest, believing prices will continue to rise forever. This behavior mirrors what we’ve seen historically before major crashes.
04:48
3. Monetary Policy
Years of low interest rates and massive government debt have inflated this bubble.
05:23
If we look at the chart, we see growth fueled by near-zero interest rates following the 2008 financial crisis. Companies financed their growth cheaply, leading to overvaluation.
07:12
But the rise in interest rates exposed that many companies lacked sustainable growth. Yet, despite these rate increases, the bubble continues to inflate, fueled by massive government spending.
08:26
When this bubble bursts, the fallout will be extreme. The system is so interconnected that one spark could ignite a fire that brings everything down.
08:57
A stock market crash won’t just impact investors. It will lead to more layoffs, rising unemployment, and businesses closing their doors. If the government steps in to spend even more, it will erode the dollar’s value, further chipping away at our purchasing power.
10:01
This unsustainable system is why I don’t put my faith in the government. I focus on protecting my wealth outside of fiat currency, with physical gold and silver.
11:10
If you’re concerned about this everything bubble and don’t have a plan in place, or if you want a second opinion, talk to one of our expert analysts. They can help you prepare based on your specific concerns and goals.
11:40
In the meantime, thank you so much for being here. I’m Taylor Kenney with ITM Trading, your trusted source for all things Gold, Silver, and lifelong wealth protection. Until next time.
SOURCES:
https://finance.yahoo.com/news/warren-buffett-labeled-playing-fire-140032325.html
https://www.longtermtrends.net/market-cap-to-gdp-the-buffett-indicator/
https://www.msn.com/en-us/money/top-stocks/warren-buffett-s-warning-to-investors-is-hard-to-ignore/ar-AA1xamnq?apiversion=v2&noservercache=1&domshim=1&renderwebcomponents=1&wcseo=1&batchservertelemetry=1&noservertelemetry=1
