VIX Volatility Index
video
YouTube Transcription “VIX Volatility Index”
Hi everybody Lynette Zang chief market analyst here at ITM Trading a full-service physical precious metals brokerage house well today we’re going to talk about the VIX Volatility Index and what it’s really telling us and why it actually matters and how it impacts you.
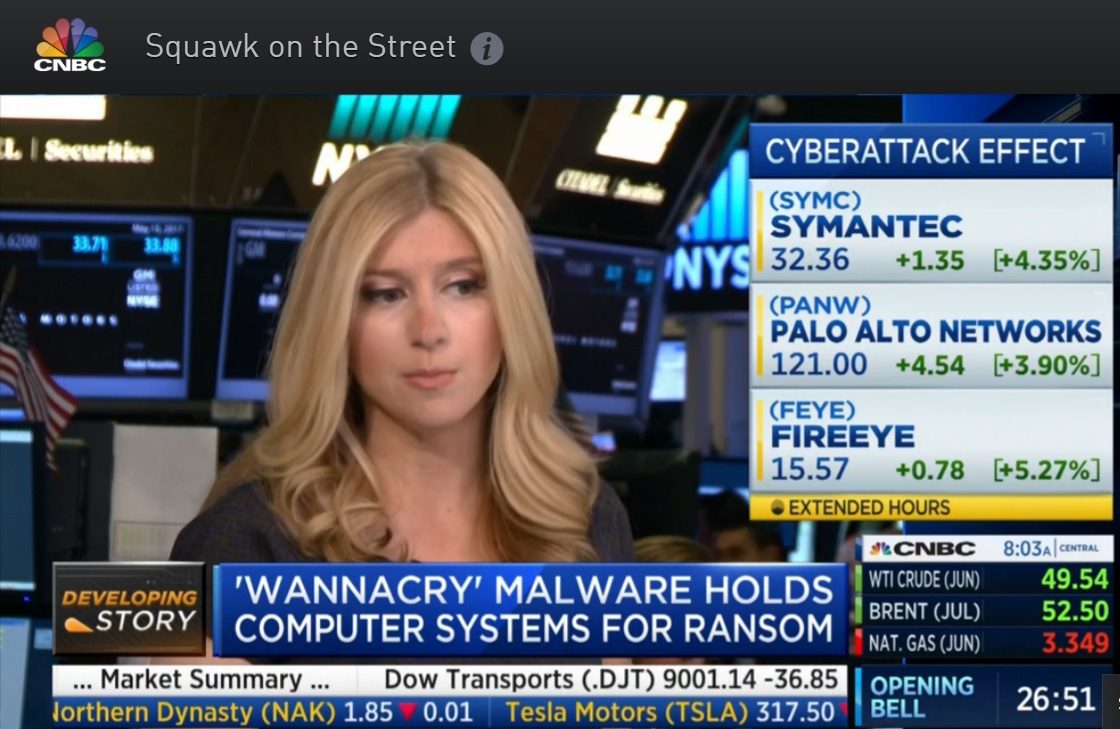
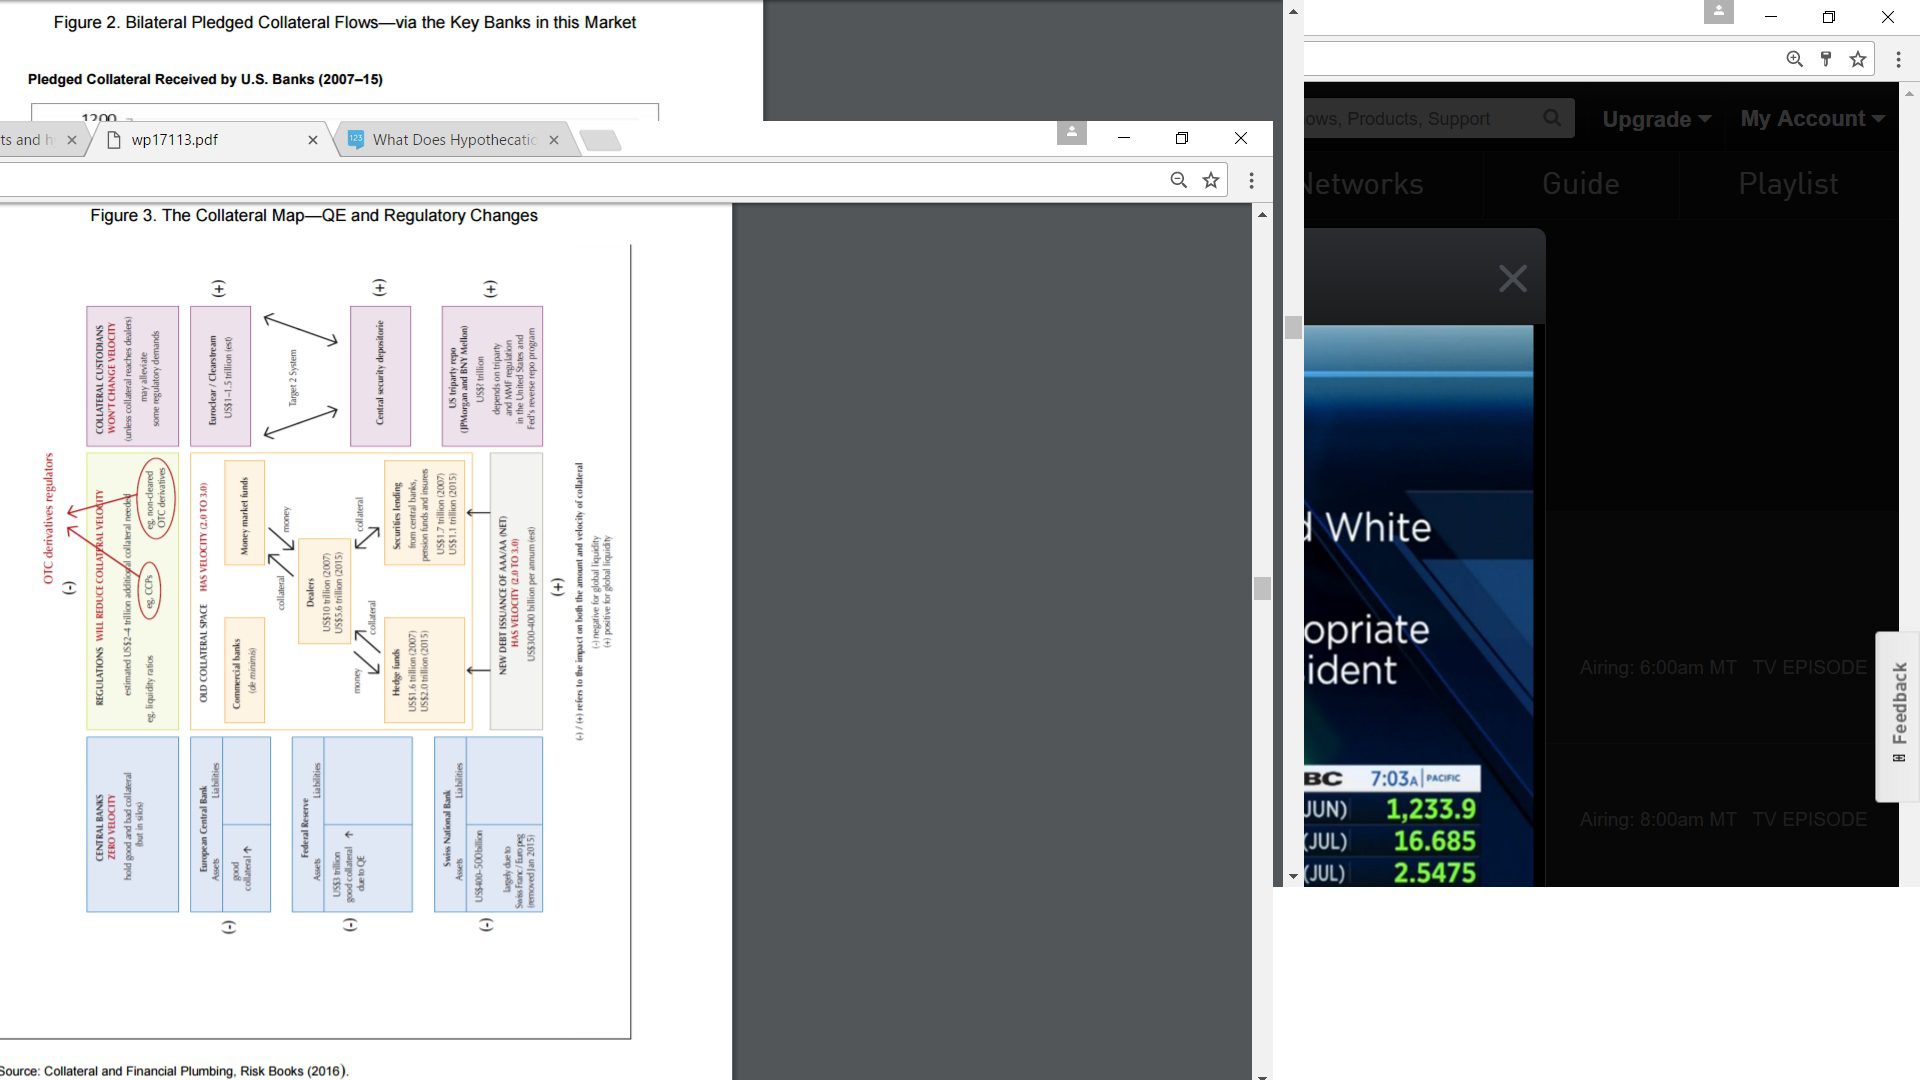
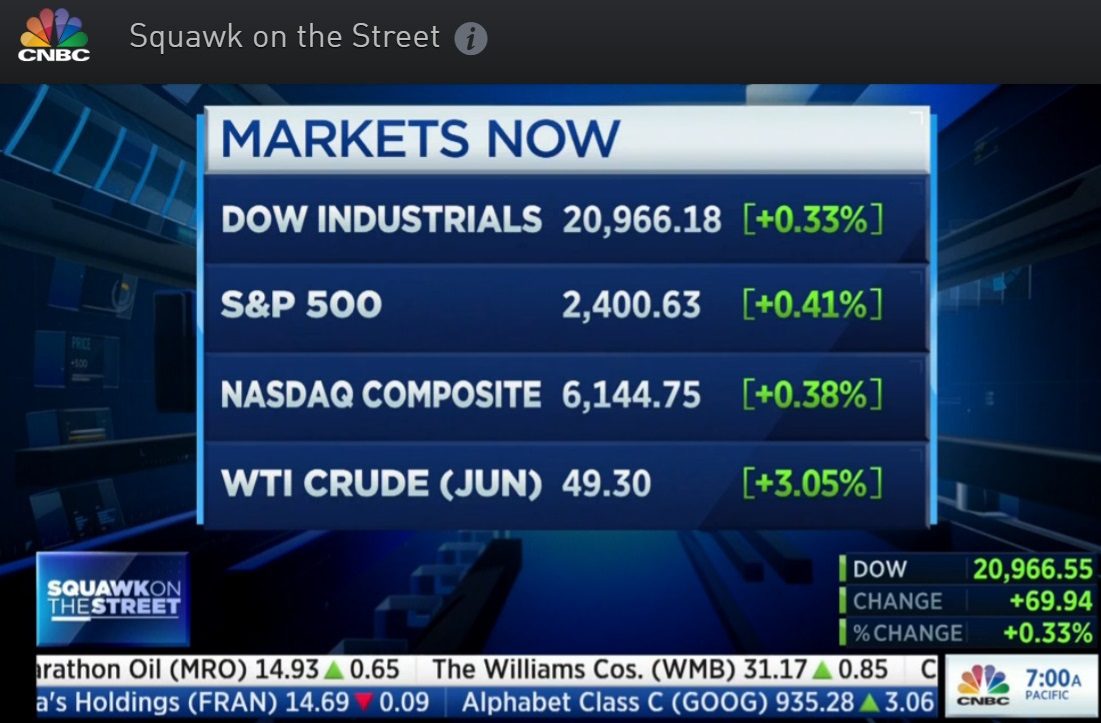
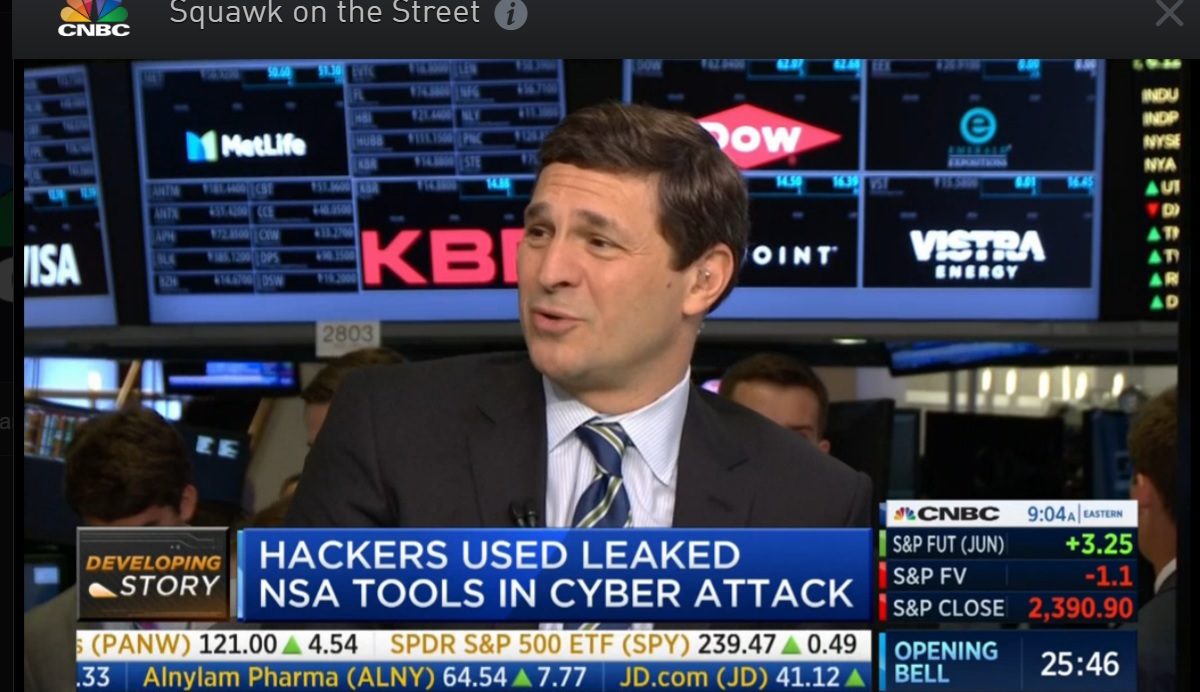
I’m going to start with we’ve noticed how calm the markets are even in the face of what happened in North Korea testing a nuclear warhead that could reach the u.s. over the weekend and the global computer role isn’t actually a hack but the ransomware that was distributed globally okay and the markets. well let me show you why they must join at this point what you’re looking at is a piece from the government showing how whatever you have deposited into your account can be used by other financial institutions, So where I put a star is typically where most people hold their wealth in one of those places it could be a read it could be a money market it could be a mutual fund etc and on anything you have in their flows throughout the system and they can use that wealth to borrow on their behalf.
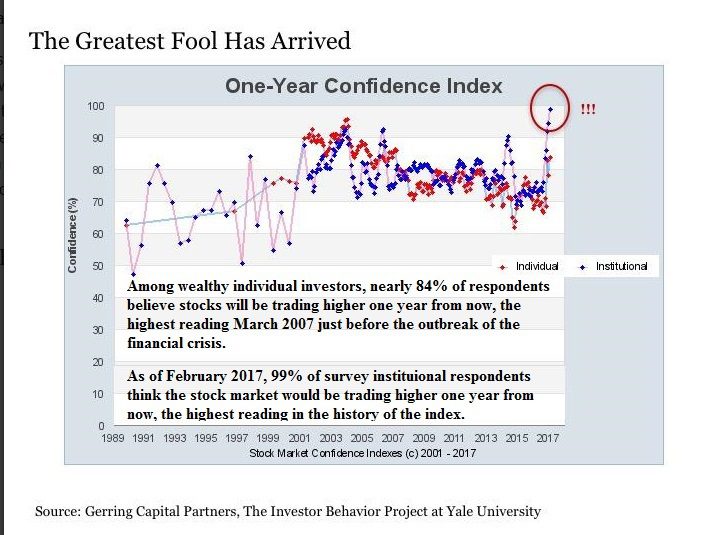
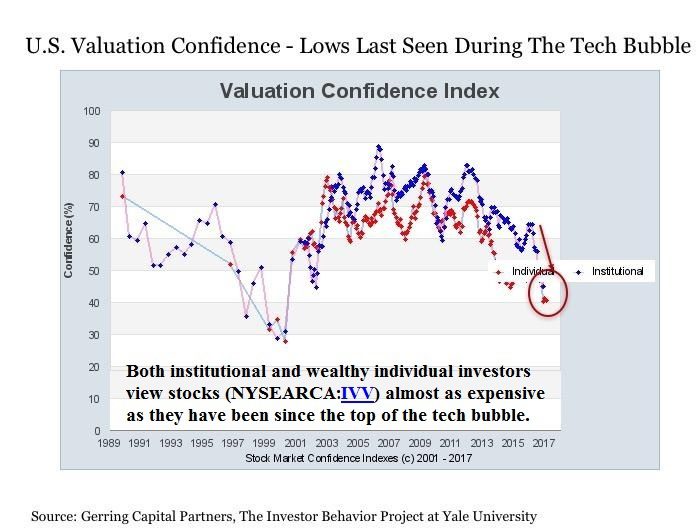
We’ve talked about that that’s called hypothecation and it’s also called pledged collateral so you can see from this most current report by the Office of the Comptroller of the currency that the banks globally use all of that collateral let’s in the system too and we’re going to talk about derivatives in a couple of minutes the blue line is from and so you can see that compare Stearns and Lehman don’t exist anymore but you can also see that a number of banks are using more and more of that collateral so they need you to keep the wealth inside of the system how can they get away with this well from a recent Yale study they certainly admit whether you’re an institution or an individual everybody realizes the stock market particularly is severely overvalued but they count on the stocks continuing to go higher the greater fool theory because what they expect is that central banks will continue to inject capital into these markets that they can keep everything propped up and you hold your wealth inside of there.
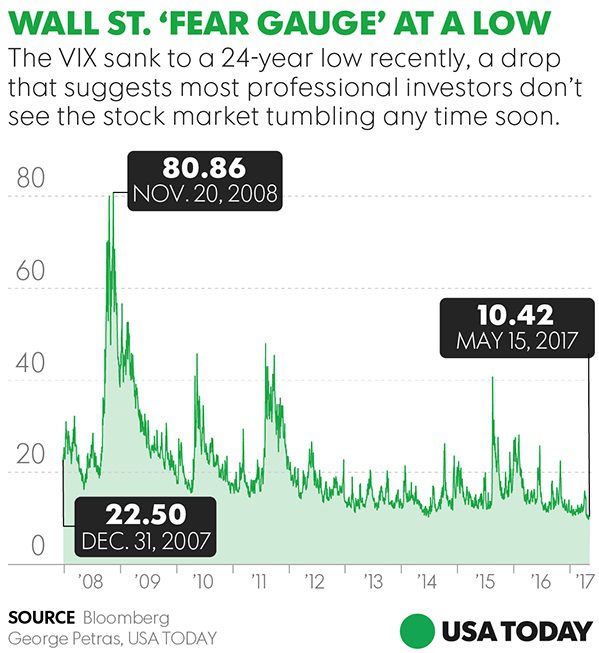
There is a Freakish Calm in VIX Volatility Index
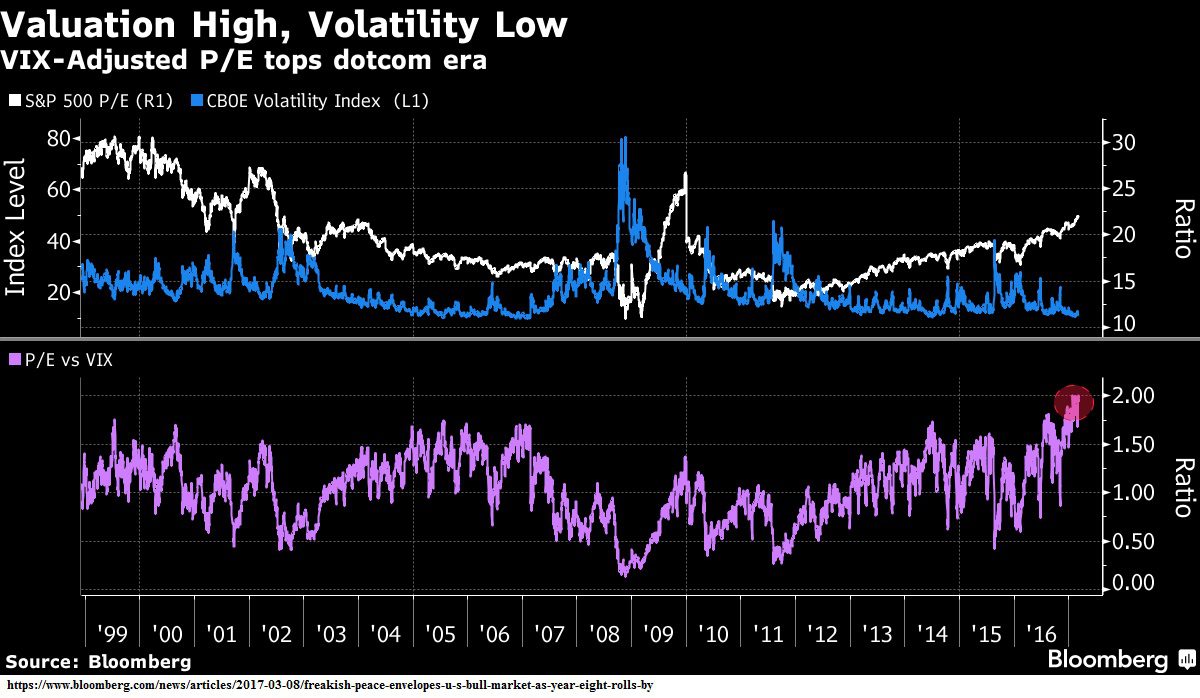
In fact they openly talk about a freakish calm in all of these markets so what you’re looking at here this blue line here is the VIX and the white line is a what is that the S&P price earnings ratio and you might notice that just before the crisis hit in the VIX was at so in other words people were really really pretty calm about what was happening in the market then just not even two months later it hit when people were really scared and that was in November of today just before we came on I pulled it and we were at : so it’s significantly lower than it was just before the last crisis became apparent to everybody this bottom line shows you the VIX compared to the price earnings or the value well the price earnings of the stock and you can see that it’s higher than it was in so this is really not a good thing you’re counting on the fact that nothing bad would happen and ignoring all of these major events that are unfolding is that are you keeping your wealth in there because the stock market is so high because you can see from this that the Dow has or the sp has gone more days without a % decline then since they started keeping records of this .
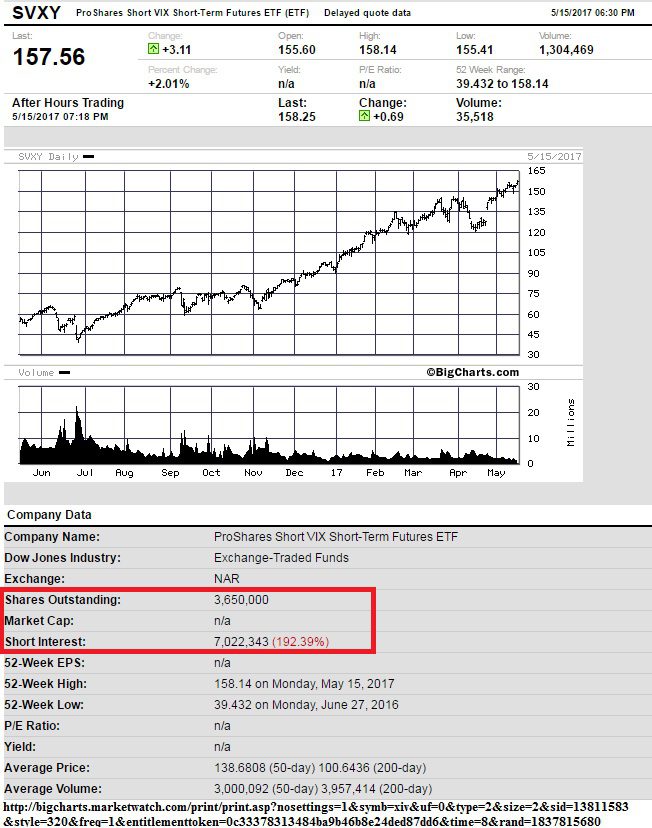
The markets are being artificially supported but there is also a break in this this is an exchange-traded fund called a xid okay and you can see that it’s been rising on this come this is a way for an investor to bet that the markets will remain calm and you can see that it’s been rising so if you go to your stockbroker you’re going to go oh they’re doing so well etc etc and by the way it’s rising on declining volume but looking a little bit underneath that what Wall Street is really doing and this is really unusual I don’t know if you can see this so make sure you go in and look at these links but Wall Street has sold a hundred more than one hundred and seventy two percent of the shares outstanding so that means that they know this market is going to crash and they’re positioned to take advantage of it.
They sold one hundred and seventy two percent of the shares outstanding what do you think happens to that punt when they go to collect and that’s not the only example that I can see more example that exactly look like that so it shows you that this market is severely broken but this is the most important graph that I am showing you today because this is the volatility index on the ten-year Treasury which is classified as a safe-haven trade and is the best supposed to be the bedrock foundation of the global financial market all of them okay so look at this first of all they created the mix on the Treasury in so it didn’t exist before that but if you look at this line and I’m going to come up close you can see can you see that those are dashes just will dashes well these dashes mean that the price movement on the -year Treasury was not great so that would make sense as the foundation so if you woke up in the morning and you were going to buy or sell a Treasury you pretty much knew what the price of that Treasury is going to be.
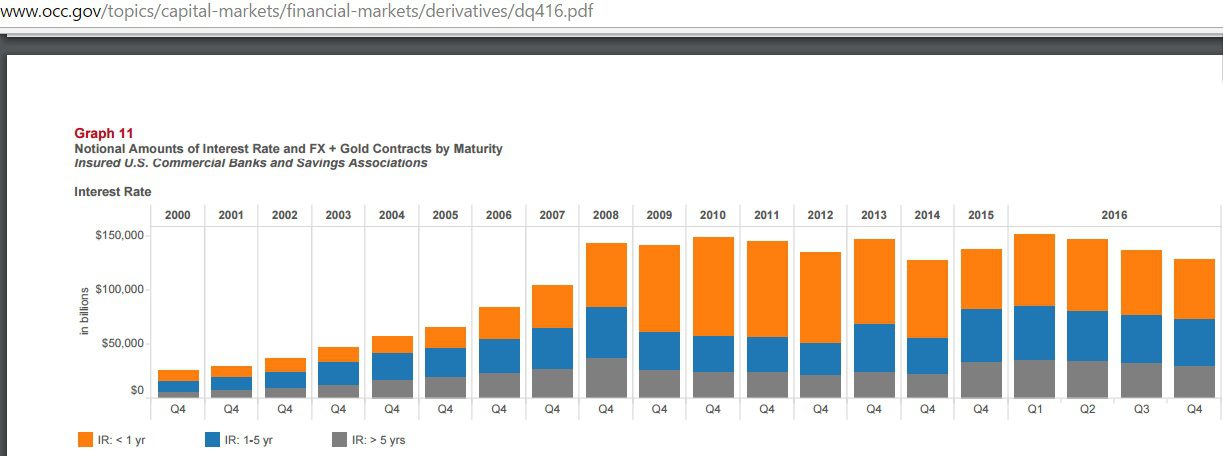
But look at what happened in those dashes became lines and this is when the central bank’s put the markets on life support okay but look at what happened in those creatively calm lines I guess you can call it became extreme and what that shows you is that the traders have taken over could be high-frequency trading but the traders have taken over the ten-year bond market at least in regards to that can you see that pattern shift from bedrock to life support to extreme because if this were an EKG this would tell you that you’re having a heart attack how long can that keep up until it gets too expensive but now I’m going to show you why and we’re going to wrap up this is again from the most current report from the Office of the Comptroller of the currency and these are derivatives in the FDIC insured banking system going through the fourth quarter this is where the crisis hit and you can certainly see that they are trading a whole lot more stock derivatives than they did before and they haven’t really eased off on the interest rate derivatives either from and keep in mind that a derivative is based upon or its current market value I should say is based upon the price movement of the underlying so they are really counting on stocks to stay stable do you see that you see why that matters and here’s a little piece in here from that same report showing the derivatives in those FDIC insured banks derivatives to assets which would include your your deposit so for JPMorgan Chase for every dollar one dollar of assets they I have reporting . cents worth of those bets for Citibank for every dollar it’s . cents both in fact for every dollar . cents Bank of America dollars and cents for every dollar so you get the point that if there is a derivative of closure when these markets move at a to wide range is going to trigger those derivative this and it will take down the whole system and this is just in the FDIC insured bank and oh by the way on goal here’s the graph from that same report on spot gold and you can see yours this is where we are right now and this is just one little area where they can sell a whole lot of derivative gold and move those prices.
I’ve showed you the Comex I’ve shown you other areas where they can do that manipulation as well it’s layers it’s layers of leverage it’s layers of bets is layers of everything and you my friend if you have any wealth in the system you are not the legal owner of anything but a contract and any contract is only as good as the counterparty to that contract and let me tell you if they’re selling all of these things that they’re trading this they need your wealth in that system they’re getting out we look at that every week I always suggest you do with the smartest guys in the room on any given topic are doing for themselves I’ve just shown you why they need these markets calm you be smart and you take care.
So that’s it for today follow us on Twitter like us on Facebook subscribe to the YouTube channel we’ll let you know when we’re doing these live and give us a call nine six four six five three and share share this with everyone as full out there bye-bye!
Images for VIX Volatility Index
![]()
![]()