US Money Supply (M2) in Greatest FREE-FALL Since 1930’s.
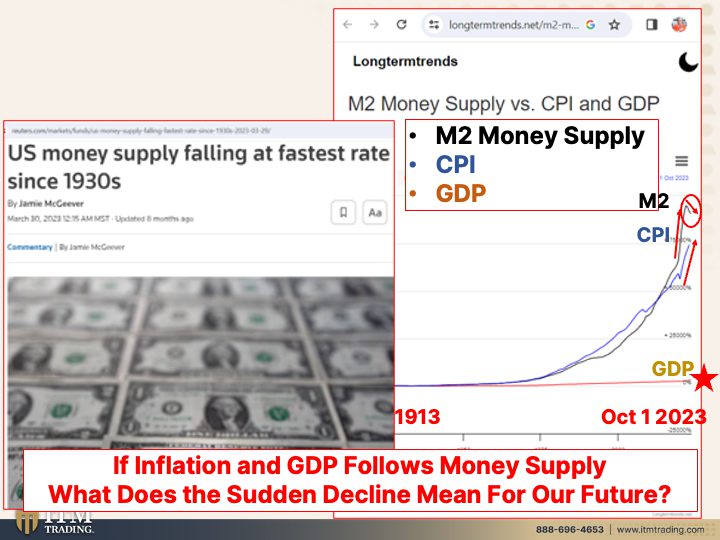
What you’re looking at here is the M2 money supply, which is not the broadest base of money, but the second versus the CPI. So inflation consumer Price index versus the GDP. So that’s all the money that flows through the U.S. system. And we’re going to start on March 1st of 1913. And then the Federal Reserve was installed in December of 1913. And you can see how all of these lines and graphs merge, right? So the black line is the money supply. You can see how much that has gone up. And then the blue line is the CPI. So the inflation gauge Consumer Price index and that line down there is the GDP, gross domestic product. And the reason why I said that this is like the saddest graph is simply because it takes more and more inflation and more and more money.
CHAPTERS:
0:00 The Saddest Graph
1:10 M2 Money Supply Vs CPI VS GDP
4:37 Velocity of M2
10:50 Beginning of This Current Life Cycle
13:07 Did M2 Lead To Great Depression
18:28 Gold – Long Term Prices
23:24 How Do You Go Below Zero
SLIDES FROM VIDEO:
TRANSCRIPT FROM VIDEO:
00:00:00:00 – 00:00:21:18
I recently did a video on the shift, what I consider to be the most significant pattern shift through this trend cycle on the money and what’s happening in the money supply. And I realized that they didn’t have a long term chart in there. So I went back and I did that work and we’re going to talk about it today.
00:00:21:21 – 00:00:38:25
But what I’m about to show you is probably about the saddest graph. Yeah, definitely the saddest graph that I could possibly begin to show you. And let me just show you why. Coming up.
00:00:41:05 – 00:00:53:11
I’m Lynette Zang, chief market analyst here at ITM Trading. A full service is a call gold and silver dealer specializing in custom strategies.
00:00:53:14 – 00:01:22:17
Because all of the foundations are the same, you’d be executing the exact same foundation as I’m executing, but it is tweaked based upon your goals and your circumstances. But let me show you something that wasn’t tweaked because it was just put out as a general. Let’s just go right to the slides. And what you’re looking at here is the M2 money supply, which is not the broadest base of money, but the second versus the CPI.
00:01:22:18 – 00:01:54:05
So inflation consumer Price index versus the GDP. So that’s all the money that flows through the U.S. system. And we’re going to start on March 1st of 1913. And then the Federal Reserve was installed in December of 1913. And you can see how all of these lines and graphs merge, right? So the black line is the money supply.
00:01:54:07 – 00:02:24:16
You can see how much that has gone up. And then the blue line is the CPI. So the inflation gauge Consumer Price index and that line down there is the GDP, gross domestic product. And the reason why I said that this is like the saddest graph is simply because it takes more and more inflation and more and more money.
00:02:24:18 – 00:03:02:20
And the GDP just hasn’t lifted off. And so when we talk about and we talk about the wealth and income inequality, this is really why we have that disparity. Let’s go back to that graph. Okay. So this takes us through October 1st of 2023 and I mean, you may not realize why it’s so sad, but it is really because things are changing and they are going to get real, real ugly.
00:03:02:22 – 00:03:46:29
How much more money printing needs to be done? How much more inflation needs to happen before we shift into this new system? And will it work? No, it doesn’t work. And frankly, insanity is doing the same thing over and over again and expecting different results. But after 1971, when this was put into the hands of the central bankers, which is a profit, which is a private corporation, that’s when the real shift away from the public began, actually started back in 1913 when they installed them.
00:03:47:01 – 00:04:12:08
But now the US money supply is falling at the fastest rate since the thirties and I did go back to the third. Well, you’re going to see everything here, but you can see where this shift occurred. And I’m going back one more time. You don’t see anything that major throughout this, even after lift off a teeny bit over here, which would have been about 2008, but huge right here.
00:04:12:11 – 00:04:44:02
Make no mistake about it. Make no mistake about it, this cannot last much longer because of inflation and GDP supposed to follow the money supply. What does this sudden decline mean for our future? And boy, all of that money printing barely had any impact on GDP. So let’s look at the velocity of M2, which is the money supply and how quickly that changes hands.
00:04:44:08 – 00:05:25:14
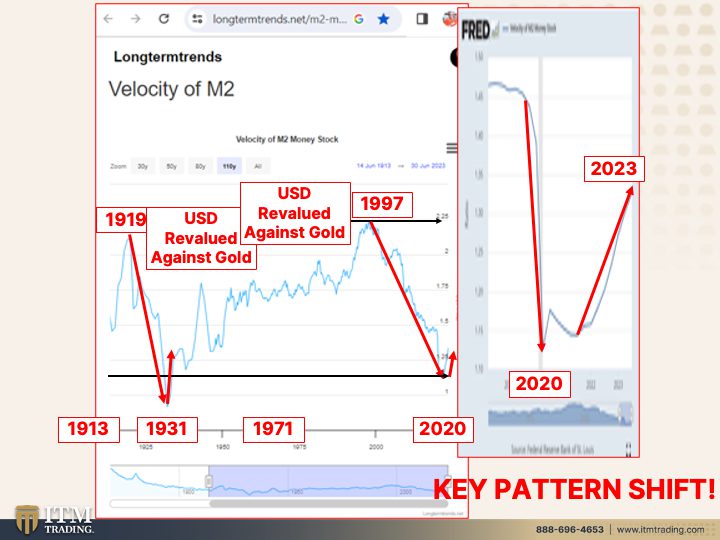
If you remember my last video that I just did on this, there is 1913, 19, 19. Okay, big dumb brewski from there, and especially from here, 1929 down. So the money supply or the speed at which money changed hands drag vertically reduced, 1931. And there you go. U.S. dollar is revalued against gold Now, it kind of looks to me like they’re talking about here for the river for the largest money drop.
00:05:25:16 – 00:05:49:10
But again, in 1971, we had that revaluation against gold. That’s the way they always do it. That’s why when people are looking to Wall Street and the spot market to show you the true value of gold, you’re not going to get that because that was a tool that was designed to keep you away from it, not drive you to it.
00:05:49:12 – 00:06:14:25
But every time they do a revaluation against gold because gold is steady, steady and it’s used in every single sector of the global economy, so it’s full utility. Honestly, that’s the challenge that I have with the crypto occurrences. What’s the utility besides being able to put it on a little disk or a little something that you can put in your pocket and go anywhere?
00:06:14:25 – 00:06:39:10
And that’s important. You could do the same thing with gold. And so that little that little component that you can hold this wealth on, that’s just a derivative of gold, but you can do that with gold. The problem is going further than that. What’s its utility? Because gold is used everywhere in every sector. But let’s go back to the M2 supply.
00:06:39:13 – 00:07:16:26
We can see the peak in 1997 of the monetary velocity. So it was at that point that taking on new debt particularly and increasing that money supply was no longer stimulative because we can certainly see the massive decline after that to levels not seen since the thirties. And now that’s a bigger picture of it so that you can see it, you can see that rapid decline in 2020 and now you can also see the rapid increase in 2023.
00:07:16:29 – 00:07:39:17
I’ve told you since the beginning and I will tell you again and hey, I could be wrong. I mean, these are not things that are within my control, but in reality, when people are trying to get rid of dollars at this rate of speed, if Ford tells the hyperinflation machinery event because we are at the end of this, there’s no purchasing power left.
00:07:39:19 – 00:08:06:09
They can make it look like it. But, you know, here’s a whole bunch of currencies that at one point had purchasing power and there’s no purchasing power left. And here’s even the silver certificate U.S. dollar Silver certificate. Yet in my day in my lifetime, I remember thousand dollar bills and there were $500 bills and $10,000 bills and $5,000 bills, you don’t see them anymore.
00:08:06:09 – 00:08:29:00
So if you are born after, say, because they kind of went out of circulation right around 1971 ish. So if you were born, then you probably never even realized that there were larger bills. And the point for governments is to restrict your ability to carry a lot of wealth with you if you need to leave. This does just the opposite.
00:08:29:02 – 00:08:57:16
So I want you to really think about that. But what is the next thing that’s going to happen? Because I consider this also a huge key pattern shift. So it is not an accident that we’re watching the money supply shrink at the fastest level since the thirties. And we’re also watching more people spending the velocity of money increasing at that same time.
00:08:57:18 – 00:09:26:11
Taken together, it tells me that the hyper inflationary depression is has already begun. We just don’t see it yet. And what that also means is that time is running short. If you have not click that cowardly link below and set up your own personal strategy, get it done. Now. I don’t know how else to tell you this, but I can show you what’s happening.
00:09:26:16 – 00:09:56:05
And this isn’t my opinion. This is data. This is simply data. And I am simply reading the data. That’s all I’m doing. And you can read the data too. But these are two huge key pattern shifts. So something very nasty this way comes and more than likely it comes sooner. Then it comes later. So pay please, please pay key attention to it.
00:09:56:08 – 00:10:27:08
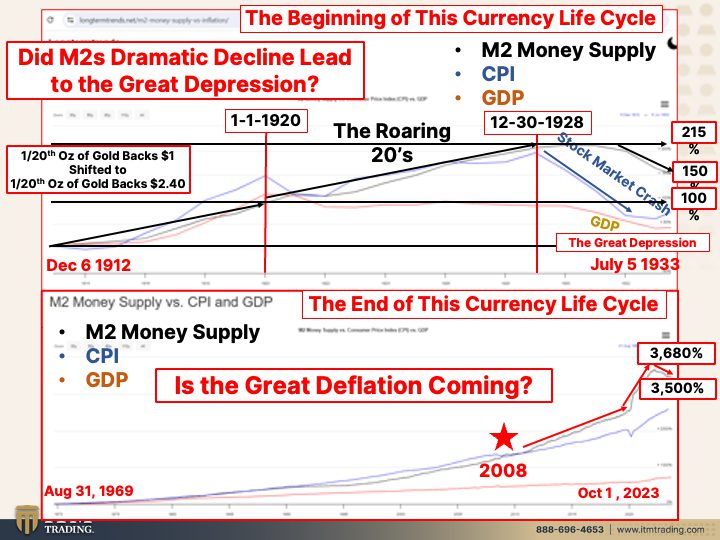
Now, what you’re looking at in here is the beginning of this currency’s life cycle. So I’m showing you the beginning and I’m showing you the end. Right. And it is again, money supply, CPI and GDP, same colors as before. There’s December six, 2012. Gosh, the GDP isn’t really all that far away from the original one. Well, this goes takes us to 1933.
00:10:27:11 – 00:11:03:04
Right. There’s your money supply. This is when a 20th of an ounce. Let me show you how big that is. This is how big that is. A 20th of an ounce of gold backed a $1 bill, a silver dollar, $1 bill backed a dollar. Then they started shifting things when they installed the Federal Reserve, a 20th of an ounce of gold back, $2.40.
00:11:03:06 – 00:11:35:23
So they printed a whole lot of money. You can see that right here in the money supply, almost double. Okay, Roaring Twenties. Now, all of this money is in the circulation and that’s what created the Roaring Twenties. Remember, you’ve heard lots of it. And then, of course, in 29, we had the stock market crash. Okay, so by the time all of the money gone into circulation, it was 215% of what it was when the Federal Reserve kicked off.
00:11:35:26 – 00:12:13:28
And then. Okay. 1230, 1928, just before the stock market crash. Look at the shift. Look at the shift right here in the CPI. All right. We are already at a downtrend pattern shift, Pattern shift, pattern shift. They mean something. And then, of course, the money supply declined and the stock market crashed and the GDP went down. But I think for the general public that was mired in that Great Depression, these were not good times.
00:12:14:00 – 00:12:56:10
But that isn’t true for everybody. And that’s the point that I want to make here. If you are in the right place, at the right time with the right asset, as we go through these crashes, in these crises, you are going to have the opportunity to grow your wealth base in wealth that you cannot outlive, which also means if it matters to you, which of course everybody knows, it certainly matters to me that, you know, I’m trying to prepare for my heirs because what they have in mind for my children, my grandchildren, my great grandchildren and on is not a world that I want to leave them.
00:12:56:12 – 00:13:32:02
I want to leave them with the ability to have freedom and make choices and to dream and have their dreams come true. And that’s why I’m doing everything that I’m doing. It’s not for me. I’m old. I’m going to be around for another probably 31 years because I think I’m going to live to be 100. But it’s going to be my children and my grandchildren and your children and your grandchildren and all those children after us that are going to deal with the consequences of the choices that we make today and the choices that the central planners make today.
00:13:32:05 – 00:14:01:13
Because you got to ask, did the M Two’s dramatic decline lead to the Great Depression? And is that what’s going to lead to the greatest depression that we’re now entering? This is the end of the currency’s life cycle. So you can make that compare. Listen. Right. So this goes back to August 31st of 1969, shortly before there was already a run on the dollar that was happening.
00:14:01:15 – 00:14:29:23
But shortly before President Nixon took us. I know they say this so nice, took us off the gold standard. well, that’s no big deal. Yeah, it is, because he handed over full control to central planners, to central banks. There’s 2008. Now, what I want you to notice here is how that CPI was running a bit ahead. I mean, pretty parallel, but still a bit ahead of the money supply.
00:14:29:23 – 00:15:03:03
And in 2008, which is when the system died, I don’t care what anybody says is when this system died. And you can see the shift and it takes more and more and more money to get greater and greater inflation. And again, has all of this money and all of this inflation has frankly barely moved the needle on the GDP, which could be how that all of that money is distributed to everybody.
00:15:03:10 – 00:15:23:01
So forever, the central planners were using that trickle down theory where is if we give all the money to the people at the top, then they’re going to go out and spend it and it’s going to trickle down to all those people that the 99% on the bottom and it doesn’t work and it hasn’t worked. But they still do that.
00:15:23:03 – 00:15:47:22
I mean, they tried a little different this last crisis by giving money to the spenders because we are a consumer driven economy. So they had to do something. But you can see how much more that’s when I say it’s like pushing on a string. It doesn’t matter how much more money they create. Now they are out of tools.
00:15:47:25 – 00:16:22:08
They’ve held interest rates down to to zero for, what, 15 years? And that has created this next crisis because all of those bonds remember interest rates, principal value. So as the central banks were raising up those interest rates, the market value of all those bonds that they put out at zero went down, meaning that all of the banks, including the Federal Reserve, is installed and they’re insolvent.
00:16:22:11 – 00:16:41:18
And that’s supposed to be the lender of last resort. And all they have is this and I know a lot of people get annoyed when I use this, but this is all they have. This is all they have that in interest rates. Right? Here’s the theory. You want to you want to increase inflation, then you reduce interest rates.
00:16:41:18 – 00:17:14:21
That inspires more borrowing and more spending. You want to slow down inflation, you raise interest rates. That reduces borrowing and therefore spending. Those are the tools, money printing and creating more debt. So this debt is not payable and we’re looking at it at the beginning and now we’re looking at it at the end and we’re looking at the shift in monetary velocity because there’s been a 30 680% increase in money.
00:17:14:24 – 00:17:39:23
But that really hasn’t helped a whole lot, has it? Has it? Do you see why we have to shift into a new system? Do you see that we are shifting in to a new system because that’s gone down right about this has gone down right about the same level that we saw back in the thirties is the great deflation coming?
00:17:39:23 – 00:18:05:06
What are they going to call it? Who they are? Who knows? Who knows? But this is massively a deflationary signal. And there’s only one way to fight inflation That’s with deflation. So, hey, they’re raising in the interest rates. It’s working. But there’s only one way to fight deflation, and that’s with inflation. So it makes it really simple. It’s not like they have lots of choices.
00:18:05:06 – 00:18:37:15
They don’t there are not lots of choices. There’s one way and there’s one way to revalue a currency as well, and that’s against gold. That’s the way they do it. So honestly, it makes it super simple when we’re looking at things to determine what is going on and where are we in this trend cycle. Let’s go on, because this is the spot price of gold, which some of you watching may have noticed that it went above $2,000 today.
00:18:37:22 – 00:19:14:19
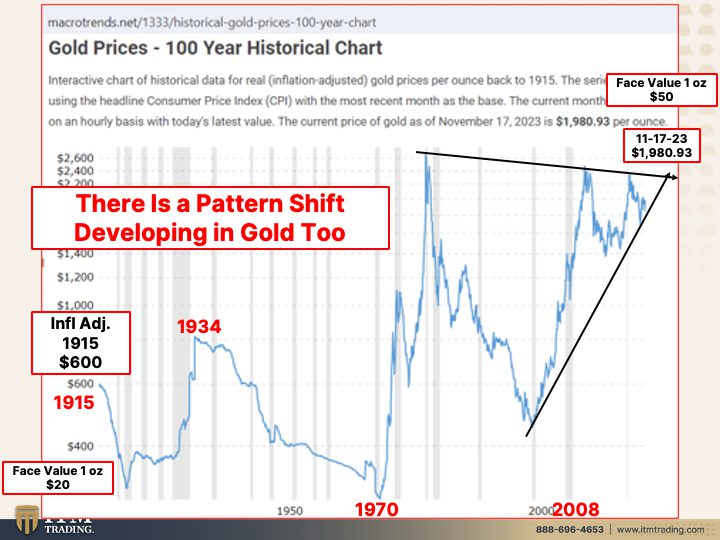
And you might even say, what do you do? Isn’t that fabulous? But remember, they can create as much digital gold. Gold that does not nor ever will exists. They could do it with silver, too, through the derivatives market. So let’s just look at this long term chart. Now, this graph is adjusted for inflation. So even though the official price of gold was 20 was $20.64 an ounce back in 1915, and today the official price of gold is $42.22.
00:19:14:21 – 00:19:52:15
Well, that’s not really, really 80. Back in 2015 from how much new money they printed. So inflation adjusted, it would have been 600 bucks an ounce, even though the face value was 20 bucks an ounce. 1934 okay, they did that revaluation where they revalue this against that. That’s always the way they do the revalue those overnight revaluations and you can see how rapidly spot gold went up here.
00:19:52:20 – 00:20:24:22
That was the first revaluation. Then here then there. Okay. 1978. All right. Pushed it all the way down because after all, they don’t want you to know, are rising gold prices an indication of a failing currency and the U.S. dollar as the world reserve currency was certainly, certainly failing on a global basis in 1970. And as I told you before, there was a run on the dollar.
00:20:24:24 – 00:20:57:28
So once they released gold from its tethers after 1971, you can see that in inflation adjusted terms, it went up to 2600 bucks. Have we hit that yet? No. Will we do it this year? Next year, maybe. But is that still the value of it? No, not really. But what we do have here forming is a wedge. And I’ve talked to you about wedge formations.
00:20:58:01 – 00:21:27:24
Now, this was on the 17th today. Like I said, it broke above. But what you’re likely to see is spot gold going into it range until it breaks above here. Okay. Once it breaks above here, then the next most likely outcome is it for it to go even higher. And we do have that wedge formation. How do you get it higher and higher lows, Lower and lower highs looks like a wedge of cheese.
00:21:28:00 – 00:21:59:12
If it breaks down below, the most likely outcome is for it to continue to drop. If it breaks out above, the next most likely outcome is for it to go much higher. So we’re going to see where all of this takes us. But you can see that there is likely to be a pattern shift. And even though the US, the official U.S. price of gold is $42.22, which is where it’s been since 1970, if you’re buying and I don’t even have any, so I can’t even show you.
00:21:59:15 – 00:22:30:13
But if you’re buying bullion like an American eagle, it’s got a face value of 50 bucks. You’re going to sell it for 50 bucks to the cost of 50 bucks to buy it. It’s part of the psychology, though, definitely. So what I really want you to notice here, though, is that we have seen some key major pattern shifts that have occurred in the money supply and the money velocity.
00:22:30:13 – 00:22:53:10
And I take this so seriously, I cannot tell you how seriously I take it, but there is also a pattern shift that is developing in spot gold, too. And I take that just as seriously. We’re going to watch it. They’re going to have to suppress it. But what this really shows me is that the markets are overwhelming the ability of suppression.
00:22:53:12 – 00:23:24:19
So we’re coming to it. We’ll see what happens. But I did want to go over that more thoroughly because of how critically important I view this pattern shift to be. And I told you when I saw that the inflation was kicking in, that I felt that that was the beginning of the hyper inflationary event event. And I got to tell you, all of the signals I’m getting from this are confirming that maybe I’m wrong.
00:23:24:22 – 00:24:03:02
Maybe they can. I don’t know how. I mean, I mean, they’ve eroded your purchasing power since the moment you were born. You have lost purchasing power in the currency. How do you go below zero? How do you do it? They tested negative rates. That didn’t work either. How do you go below zero? Make sure you watch last week’s video, the breakdown of the consumer crisis that’s looming because the breakdown of the consumer, this is what’s supporting this economy, right?
00:24:03:05 – 00:24:30:14
When all else fails, that it’s the little guys and also, you know, don’t forget, now we have this wonderful desk of reporters. I’m part of that, but so is Daniella Carmona, and so is Taylor. Kenny. And we each have our specialty because our goal is to make sure that you are as educated as you can possibly be, so that you can make those choices in those decisions.
00:24:30:21 – 00:24:58:08
That puts your best interests first. What a concept. So if you haven’t done that yet, click that Kelly link below. Set up a time to speak to one of our consultants and get your not just don’t talk about it yet. It executed. I’m seeing these pattern shifts I’m showing you them to you you got to know I can’t tell you the exact moment, but I can tell you it feels awful close to me.
00:24:58:11 – 00:25:24:18
Awful, awful close. And if you haven’t yet, make sure you subscribe. Give us a thumbs up. Leave us a comment and share. Share, share. Because we are really all in this together. And besides the gold and silver, which is your wealth shield and your foundation, your data have food, water, energy, security, barter, ability, wealth preservation, community and shelter.
00:25:24:21 – 00:25:48:18
Arguably, community is the most important factor in there because we’re running out of time. So you need to get with like minded people that have different skill sets and different assets so that we can get through this together and then tell them next we meet. Please be safe out there. Bye bye.
SOURCES:
https://www.longtermtrends.net/m2-money-supply-vs-inflation/
https://www.reuters.com/markets/funds/us-money-supply-falling-fastest-rate-since-1930s-2023-03-29/
https://fred.stlouisfed.org/series/M2V
https://www.longtermtrends.net/m2-money-supply-vs-inflation/
https://www.macrotrends.net/1333/historical-gold-prices-100-year-chart