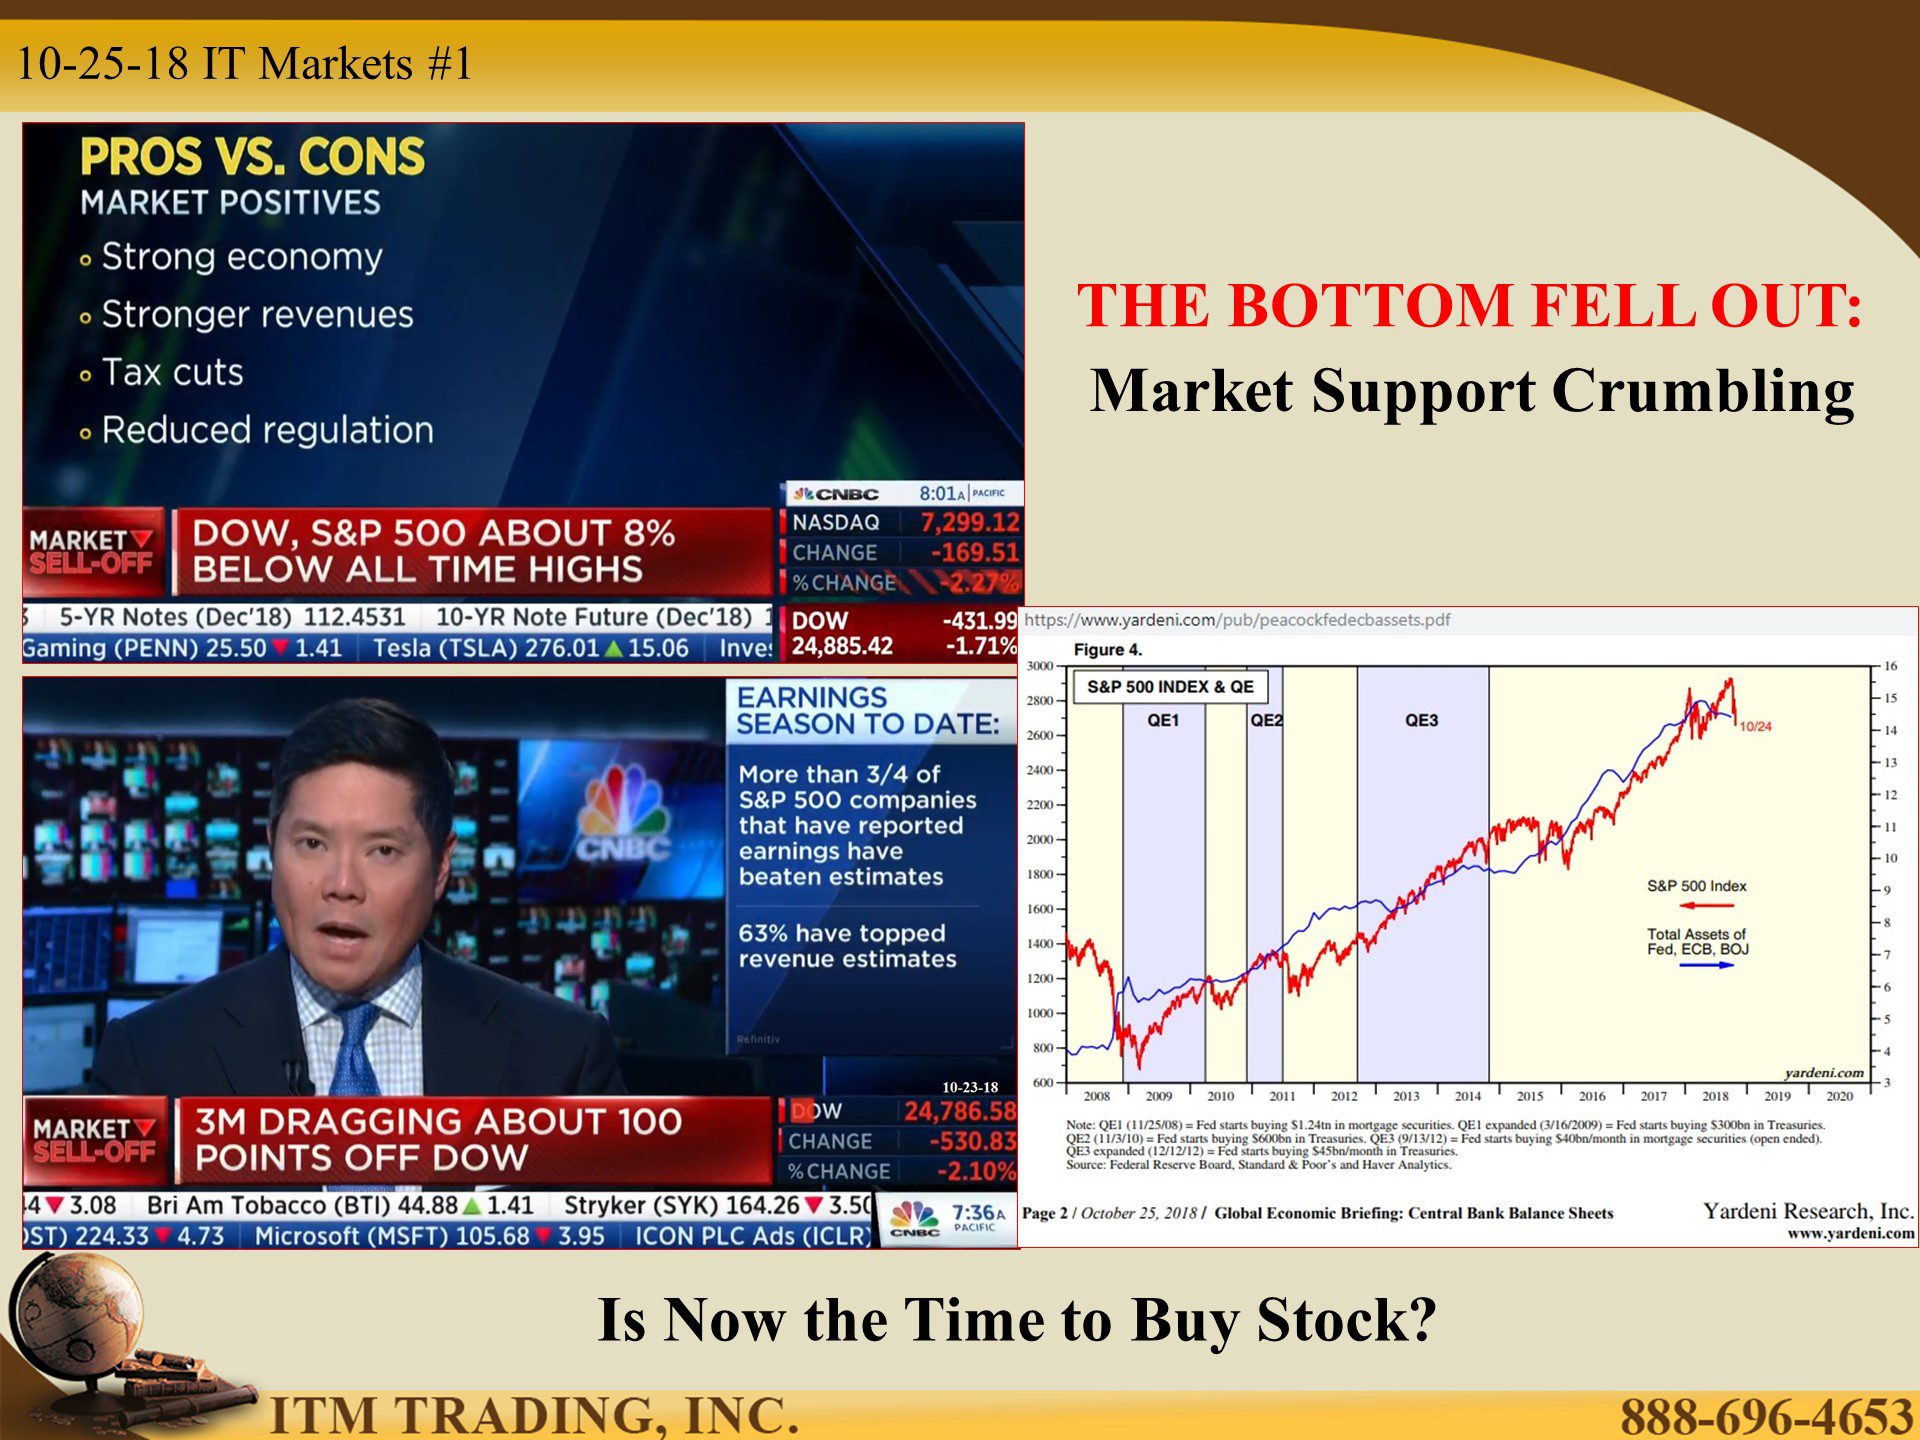
THE BOTTOM FELL OUT: Market Support Just Crumbled by Lynette Zang
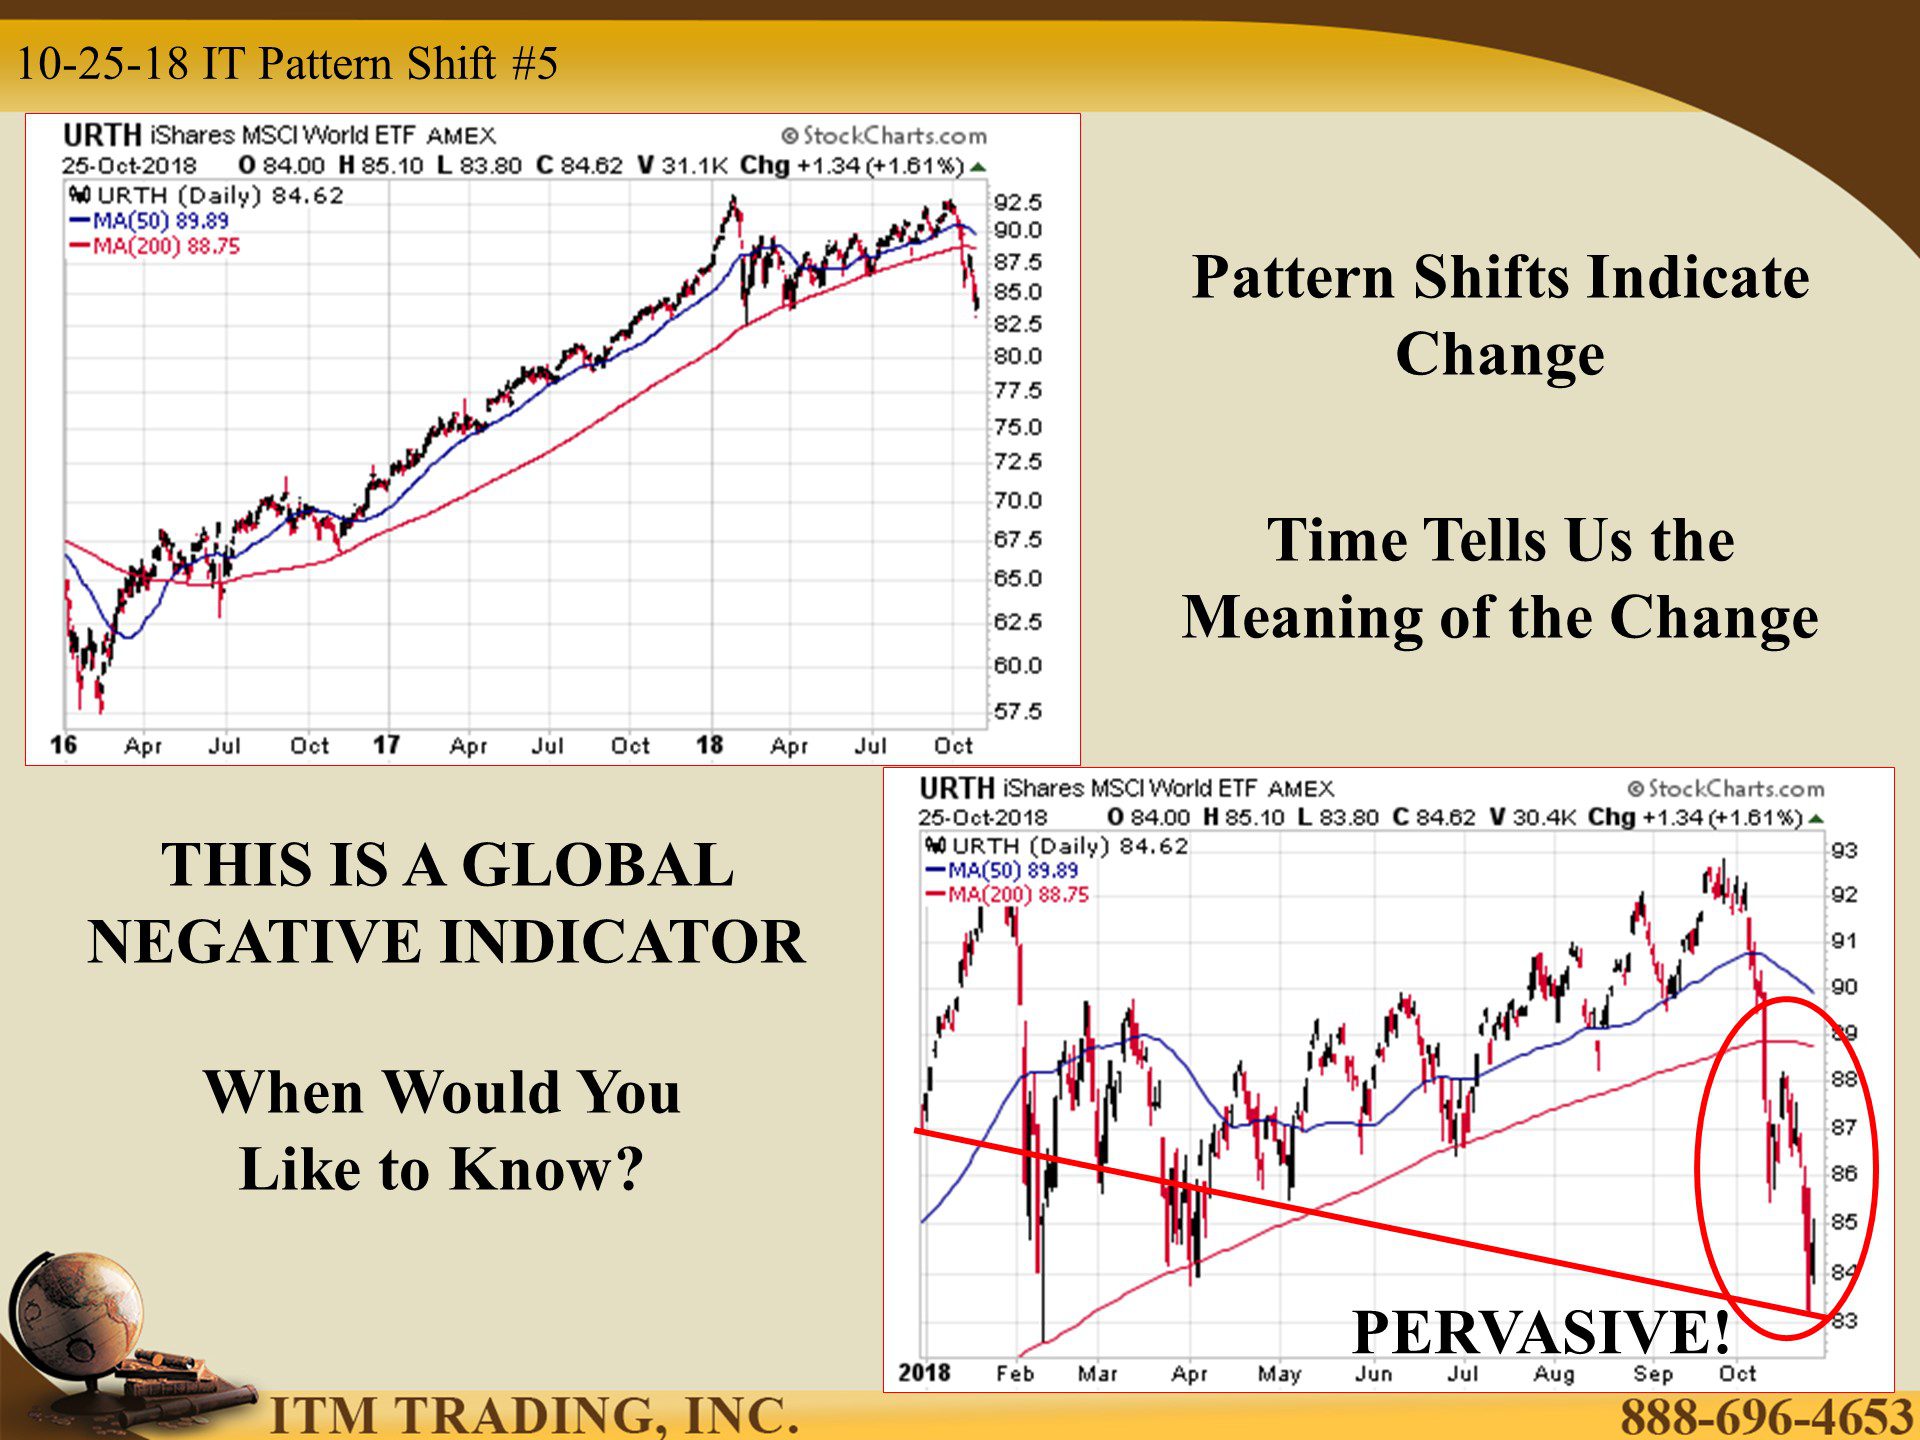
How do we know when seasons change? There is a recognizable pattern shift. If you live in the north east, as summer changes to fall the air cools and leaves change. The same things also happens in Arizona, but the shift is subtler. If you just moved there, you’re not likely to notice the change, but over time…you will learn to recognize the pattern shift and prepare for the season change.
Markets are the same and repeatable patterns let you know that change is upon us. You might not notice it for days, weeks, months and in some cases, it may even take a year before the shift becomes noticeable to the masses. But by then, it’s likely to be too late to prepare.
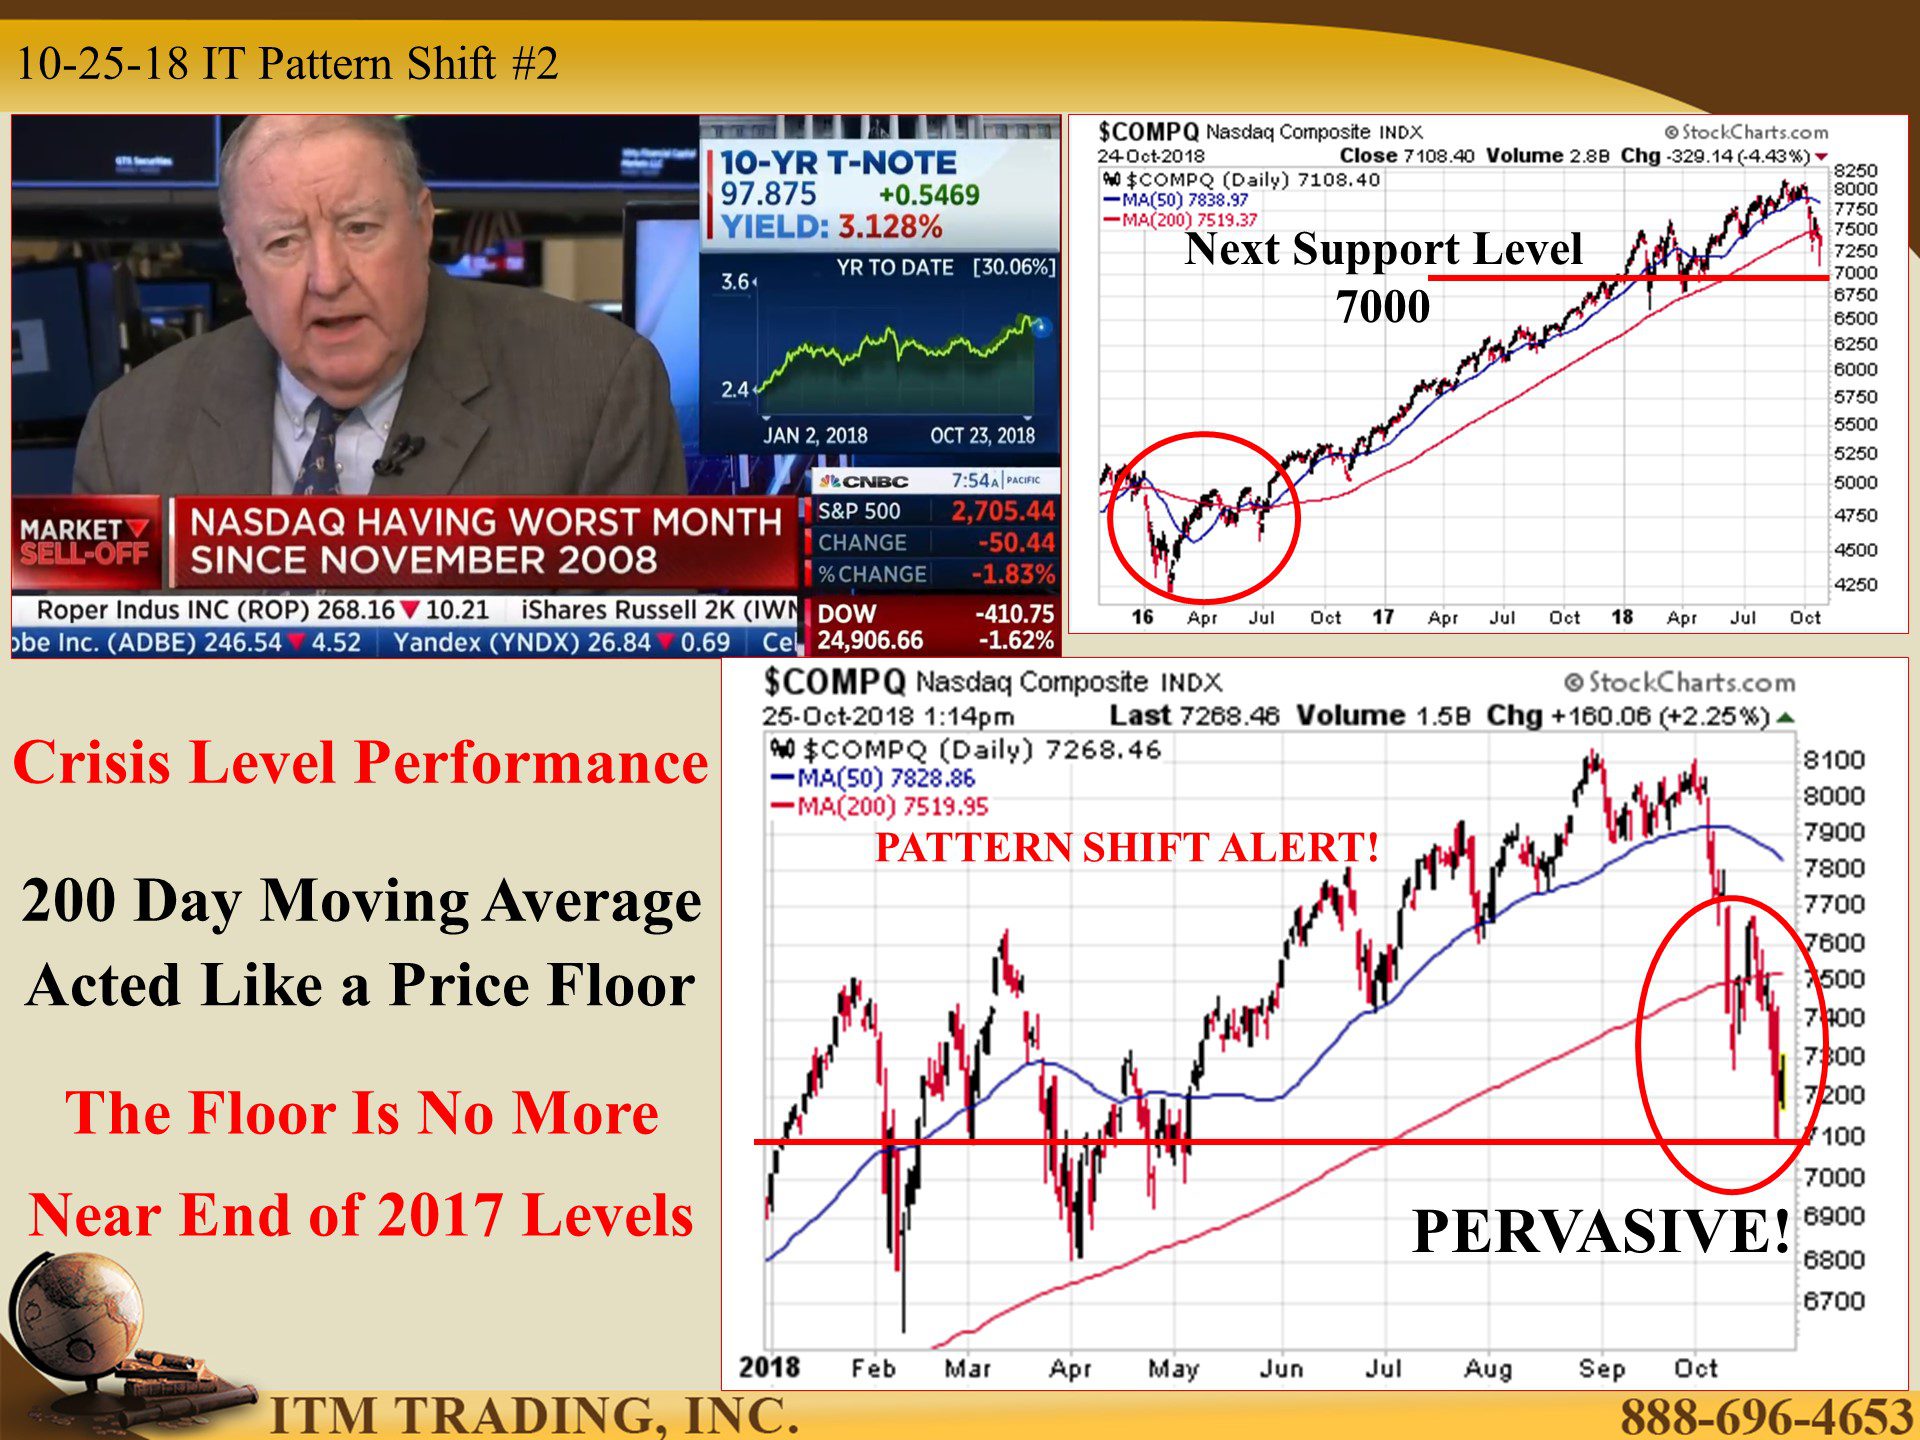
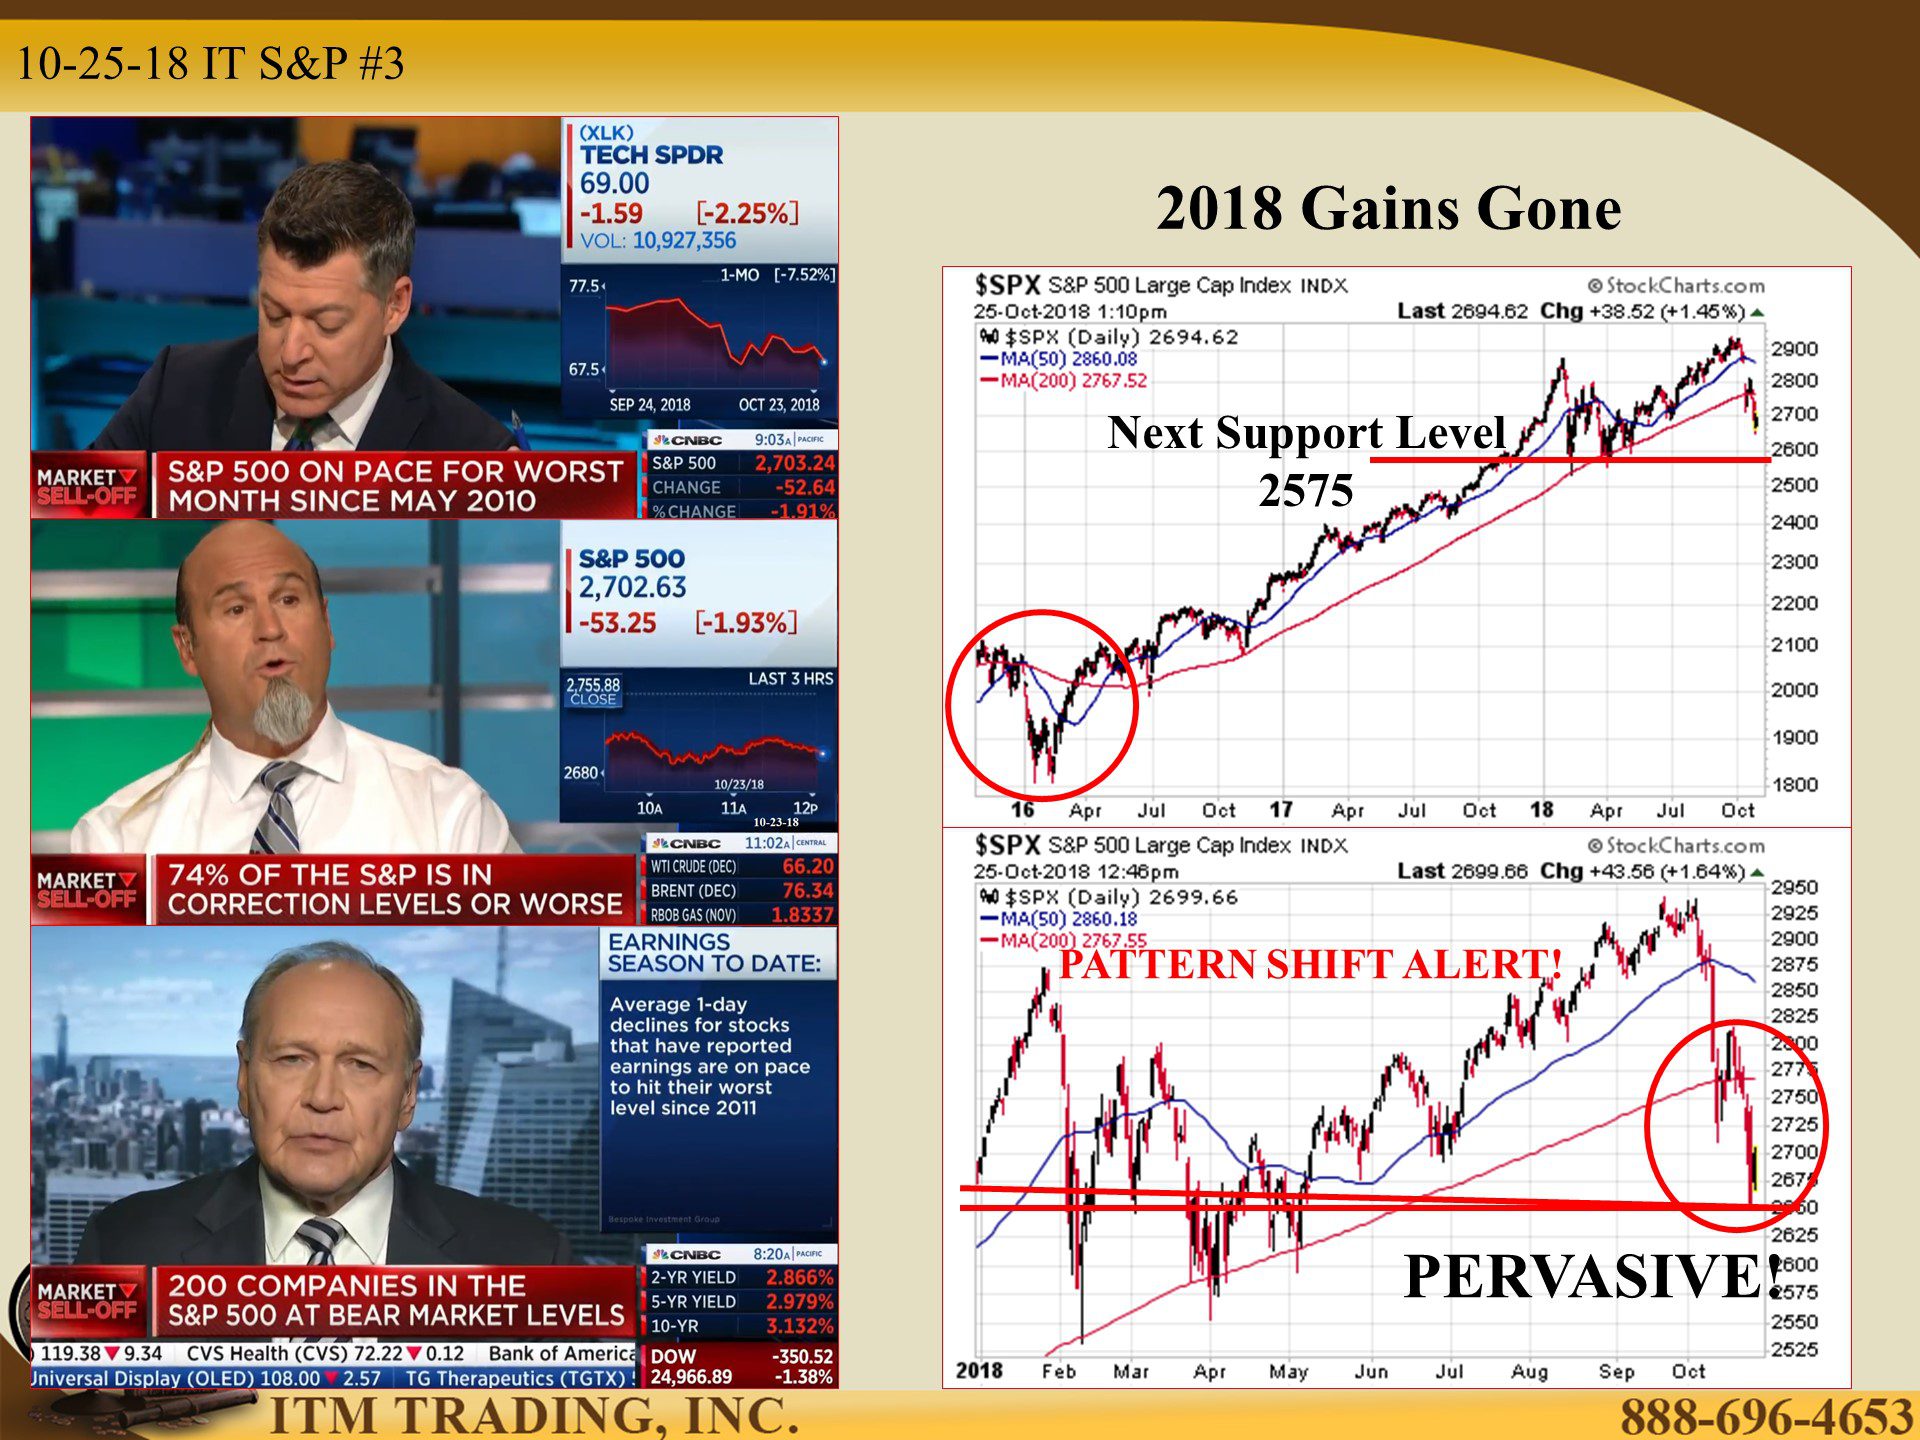
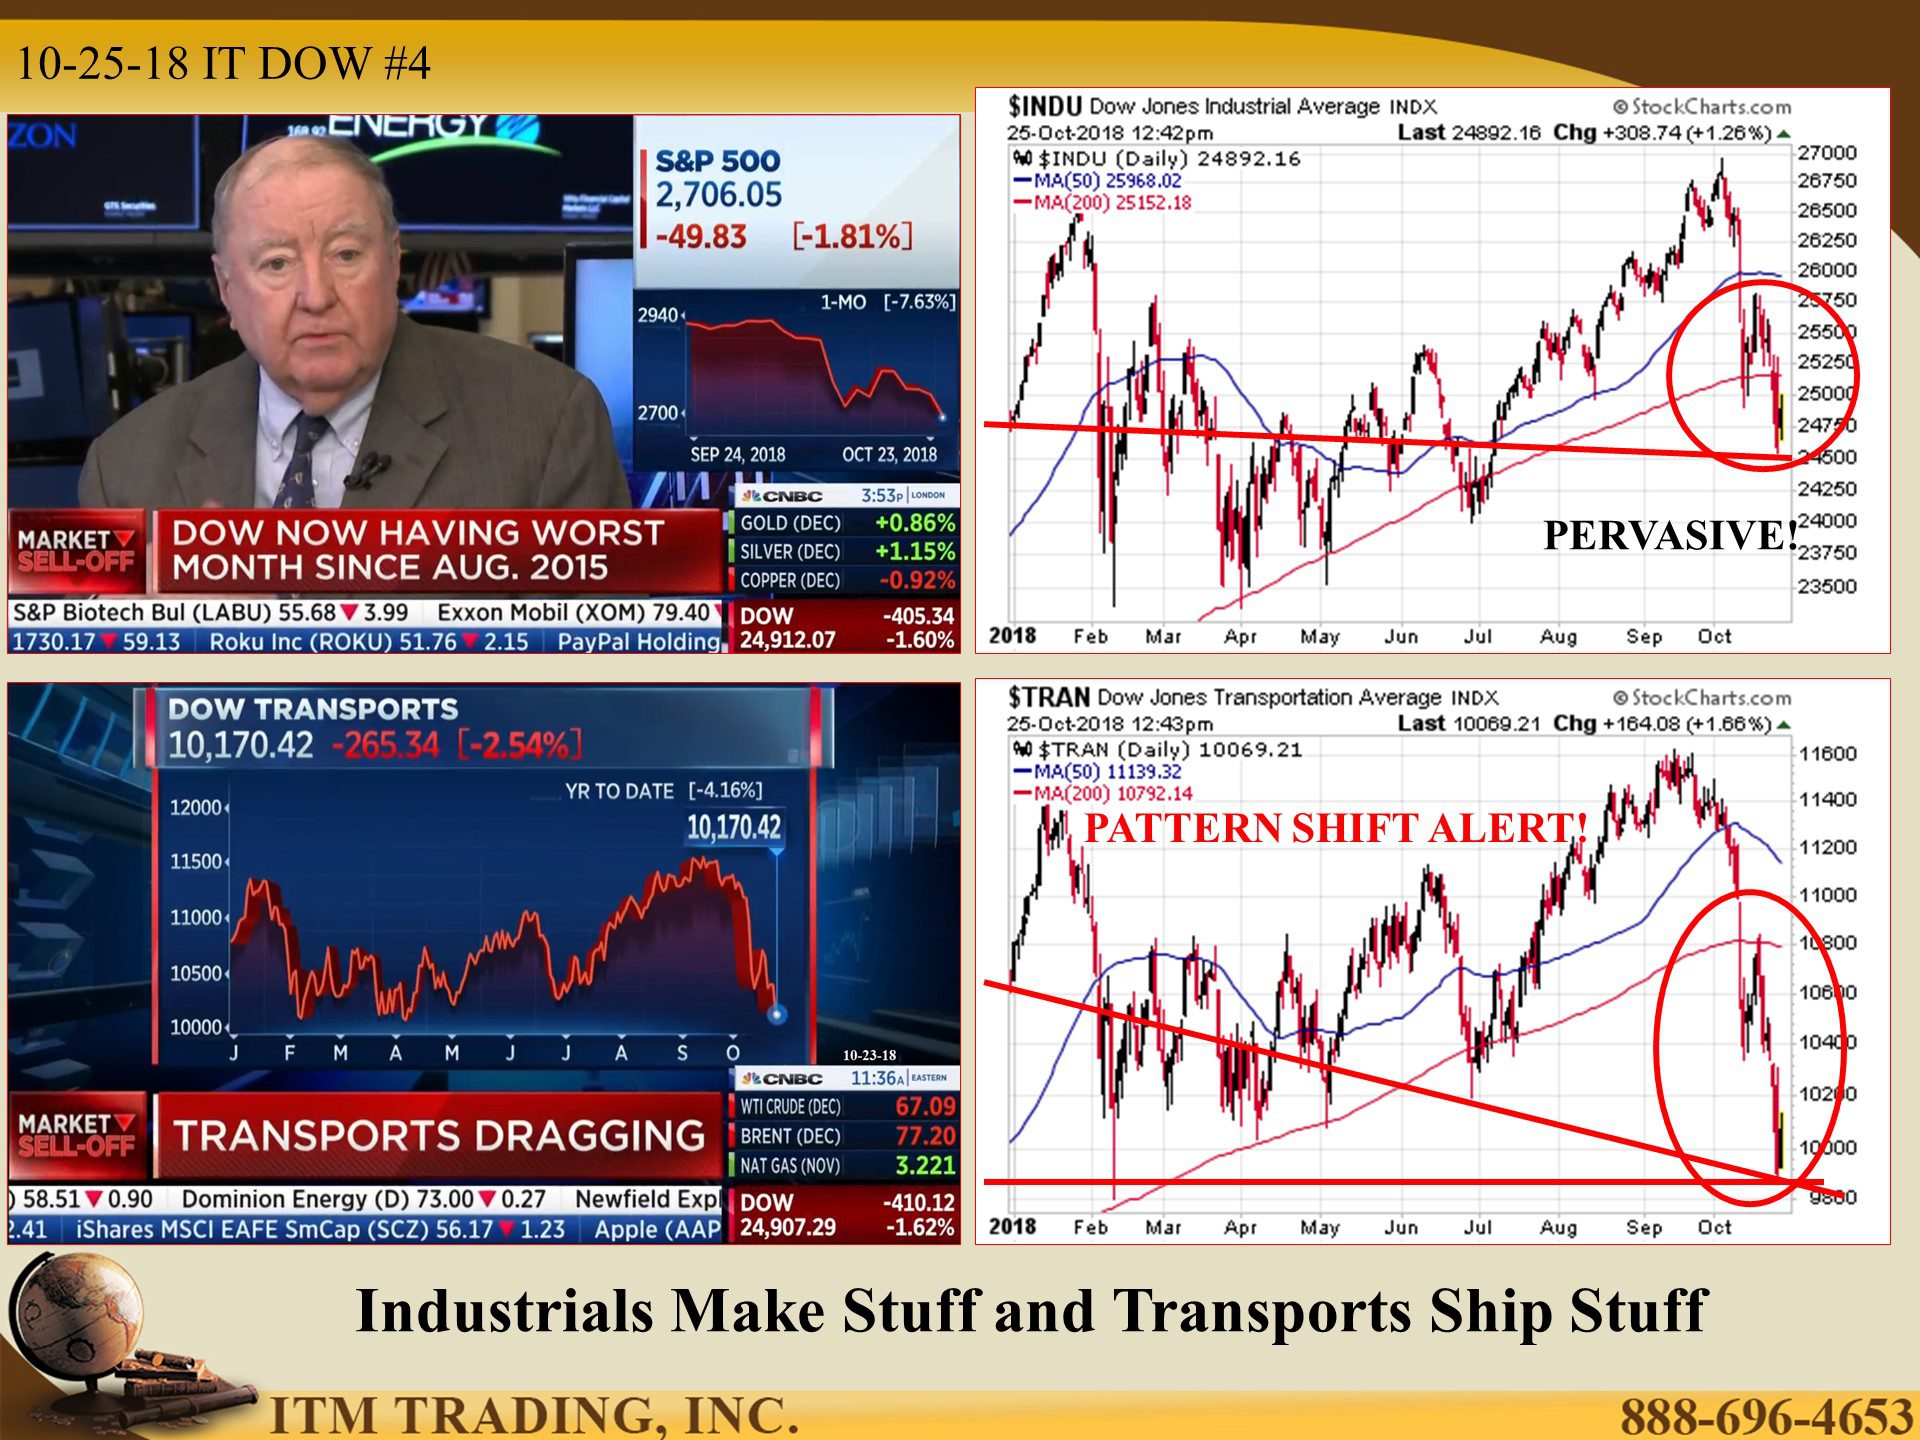
We’ve been watching quite a few pattern shifts over the last year or so. These were warning us that a market breakdown was in the works. Over the last few weeks, it’s become more apparent as most stock market indexes are below the beginning of the year levels. We got that warning on October 3rd when interest rates broke out to the upside and now US stock markets have broken to the downside.
But it’s not just that they’re lower than they were at the beginning of the year, they’ve broken below the 200 day moving average, a key technical level that has not been pervasively breached since 2016.
For me, this is an ominous sign and even if stock buybacks and the plunge protection team manage to reverse this for a minute, it will not last because the real problem is that fiat markets have lost key buyers. So who will support the markets? I won’t, will you?
Slides and Links:
https://www.yardeni.com/pub/peacockfedecbassets.pdf
https://stockcharts.com/h-sc/ui?s=$COMPQ
https://stockcharts.com/h-sc/ui?s=$SPX
https://www.stockcharts.com/h-sc/ui$tran
https://stockcharts.com/h-sc/ui
https://stockcharts.com/h-sc/ui?s=urth
YouTube short description:
We’ve been watching quite a few pattern shifts over the last year or so. These were warning us that a market breakdown was in the works. Over the last few weeks, it’s become more apparent as most stock market indexes are below the beginning of the year levels. We got that warning on October 3rd when interest rates broke out to the upside and now US stock markets have broken to the downside.
But it’s not just that they’re lower than they were at the beginning of the year, they’ve broken below the 200-day moving average, a key technical level that has not been pervasively breached since 2016.
For me, this is an ominous sign.