US Rare Gold Coins, Crossing to The Upside
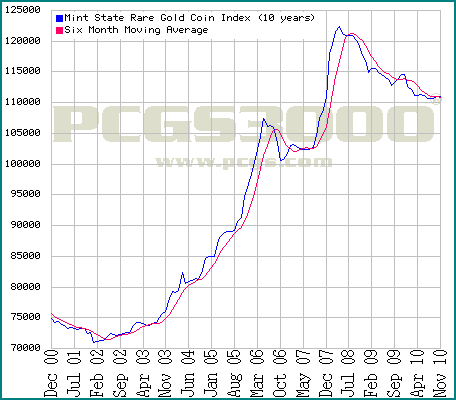
The PCGS Mint State Rare Gold Coin Index is a compilation of all US Rare Gold Coin Prices, based on recent sales collected from various points in the industry over that last thirty to sixty days. These charts assist at a technical level in determining what the most likely direction of the market will be.
As a technician, this is a key indicator in determining buying opportunities. A positive trend in any healthy bull market is looking for a series of higher highs which are strong surges to the upside in pricing, followed by higher lows which are pull backs where selling and profit taking have occurred.
The best opportunities come from buying on the higher lows after a crossing of the 60 day moving average to the upside takes place. The ten year chart illustrates that we have witnessed ten crossing points of the rare gold coin index crossing the sixty day moving average on the upside or downside since the gold bull market began in 2000. We have seen five crossings to the upside; the most recent took place in October 2010 preceding the longest higher low period that has taken place since 2000. This higher low period started in mid December 2009.
Many technical traders will buy shortly after a 60 day moving average is crossed to the upside, as this typically signifies a movement towards a new higher high during a bull market.
This is all represented in the charts below, which in my opinion is truly signaling one of the best buying opportunities for rare gold coins since the gold bull market began in 2000, I believe that this is equivalent to buying real estate before the highways go through. If you have any questions on how to buy gold coins give us a call at 1-888-696-4653.
Chart One: The 10 year illustrates the ten crossing points, five up and five down.
Chart Two: The 1 year illustrates both the down crossing in mid December 2009 and the recent crossing to the upside that took place in October 2010.