THIS IS THE FAULT LINE: Lessons From The Last 3 Crashes… Lynette Zang

As the 2008 crisis unfolded, people ran to the safety of gold and silver bullion, as witnessed by an extreme spike in coin and bar demand. Central bankers first halted gold sales and began an accumulation phase that is now at the highest levels recorded by gold.org.
At the same time, central bankers declared their intention of “reflating†stocks, bonds and real estate and used their money printing tools of interest rates and debt growth, to accomplish their stated goals. Mission accomplished as fiat money wall street products soared to new highs, both nominally and in extremely overvalued valuations. Other than spot gold and silver that is, because a rising gold price is an indication of a failing fiat money. This truth must be hidden from the average citizen, or they might make different choices.
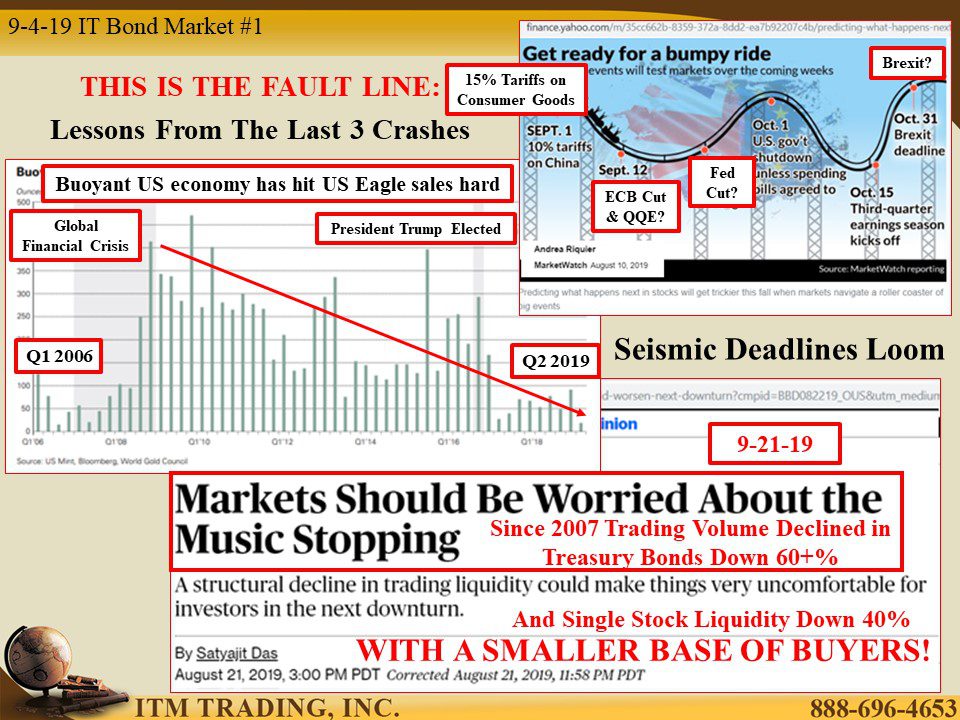
The normal public, not understanding central bank manipulations and seeking income and growth, used their wealth to take on more risk at the same time they turned away from gold and silver, particularly after President Trump was elected and his supporters believed his promise of “growth.â€
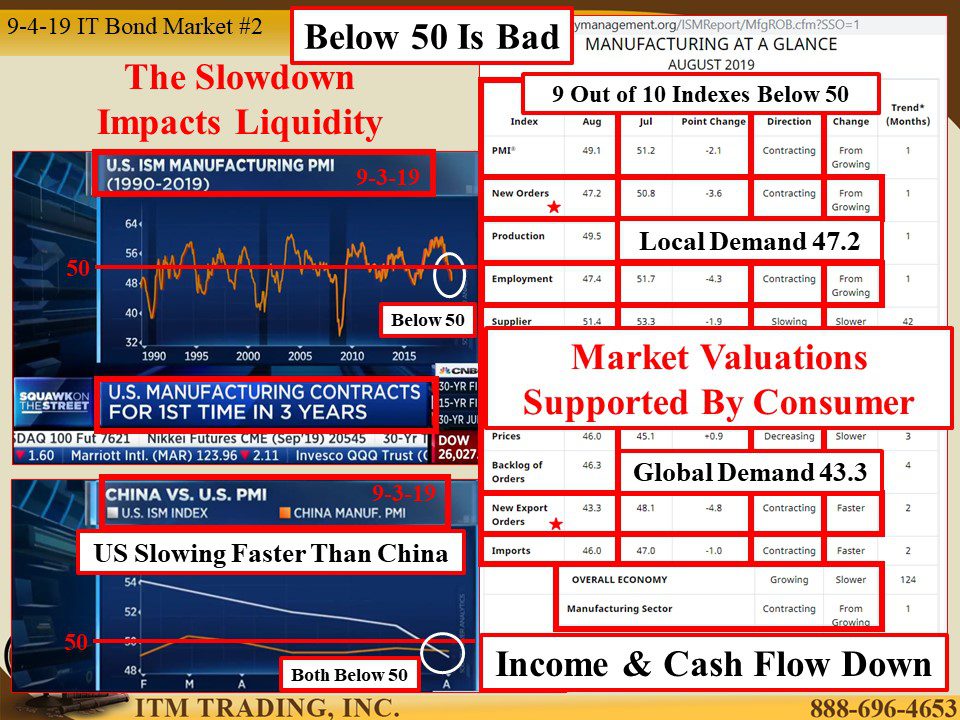
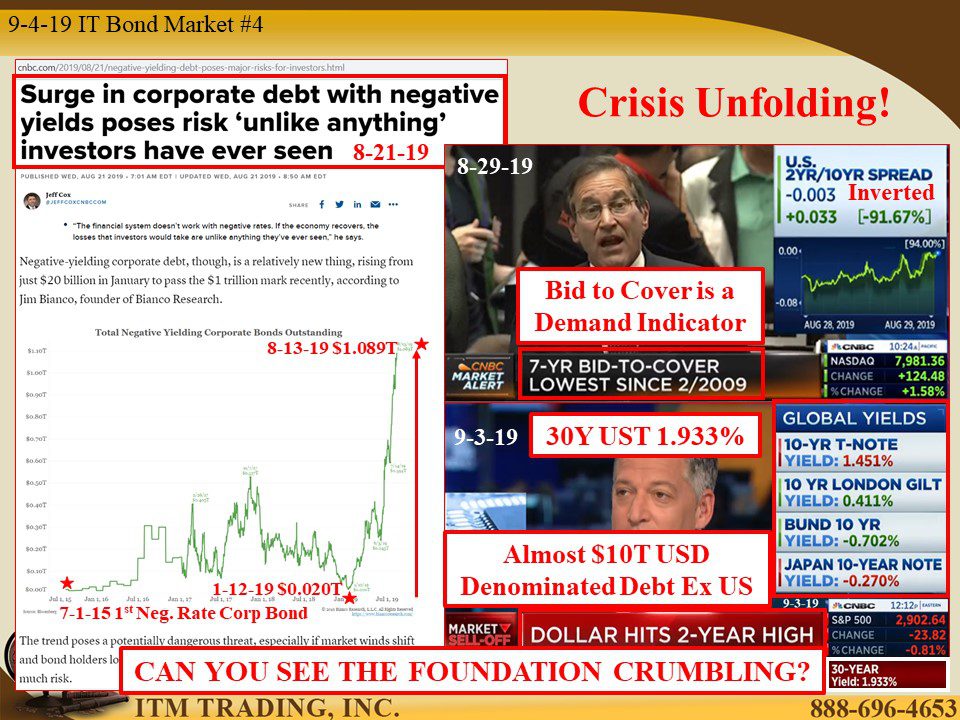
But as markets reflated, wealth was transferred out to the 1% via stock buybacks, bonuses and dividends, leaving many companies over levered and cash poor and therefore, ill-equipped to service debt levels into the next economic down turn, which by the way, has already begun to unfold and is now escalating rapidly.
Why does this matter to you? As demand increased, investor protections evaporated and much of this debt was been converted into additional leveraged products and sold back to you through pension plans, “institutional investors†(those that invest your money) and insurance companies. Who do you think runs the most risk?
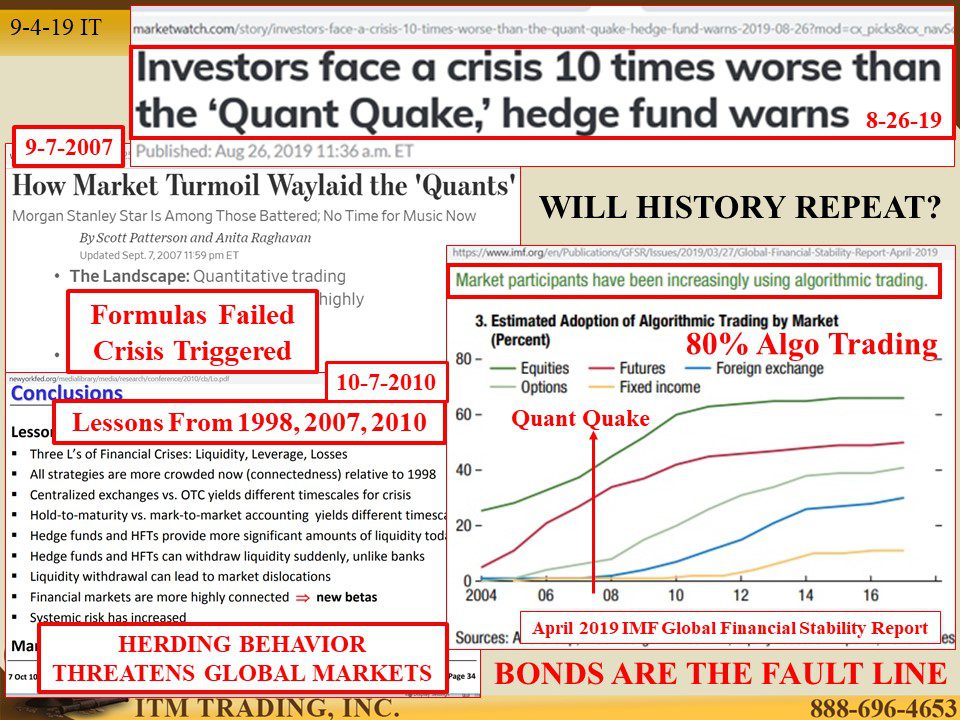
Because over that same time, the base of market buyers has been shrinking and, at this writing, 80% of all market trading is conducted by computers, guided by algorithmic formulas. Do you think history might repeat itself?
In October 2010, the NY Federal Reserve studied algorithmic trading fails in 1998 (LTCM), 2007 (Quant Quake) and 2010 (UST Flash Crash), the three fails that brought us within hours of complete financial system implosion. Their conclusions are chilling, primarily because none of the previous causes have been eliminated, they have expanded. Bottom line is that the systemic risk to the global financial system has grown while the ability to cover up the next crisis has declined. Therefore, central bankers have been voraciously accumulating physical gold.
With recent price rises in both gold and silver, some people are waiting for price pull backs. While nothing goes straight up or straight down, what is the most likely pricing outcome? The phases of the trend hold the clues to the next most likely outcome. In other words, where is the price action likely to go. The key is recognizing the patterns and phases of the trend.
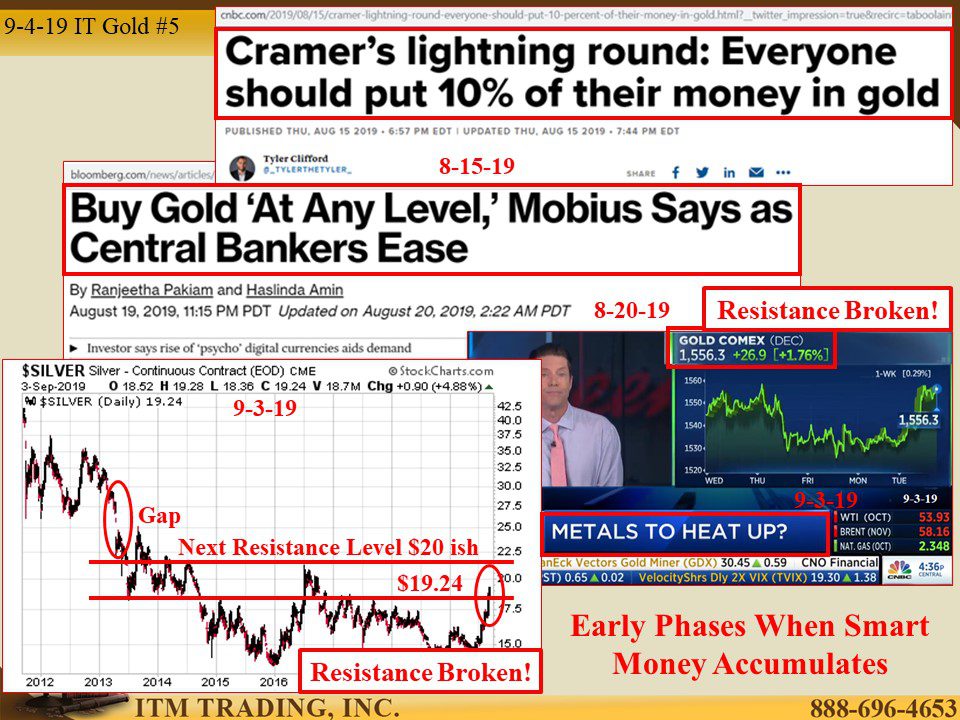
Since the trend cycle holds for all asset classes, examining the spot gold chart against the typical pattern of a trend reveals where we are and what we can expect in the future. We are coming to conclusion of the second, awareness phase in this trend that began in 2004. More specifically, we are coming to conclusion of the bear trap that began in 2011 and saw spot gold drop from $1,900 ish to bottom near $1,050 in 2016. Currently, with spot golds recent break out above $1,550, I see no resistance until spot hits $1,800, then $1,900. When we break above that, we will have entered the 3rd panic phase, which will see spot golds rapid rise.
For those waiting for a big pull back, I can tell you that I am not waiting. Gold is cheap at these levels and availability is ample. In other words, currently I can get any gold or silver that I need to support my personal strategy to sustain my current standard of living as we go through this next crisis, as well as, get into position to take advantage of the growth opportunities that will most likely present. The longer you wait, the most likely outcome is higher fiat prices and less availability.
So what are you waiting for?
Slides and Links:
https://www.bloomberg.com/opinion/articles/2019-08-21/declines-in-trading-liquidity-could-worsen-next-downturn?cmpid=BBD082219_OUS&utm_medium=email&utm_source=newsletter&utm_term=190822&utm_campaign=openamericas
https://www.wsj.com/articles/SB118912592144720147
https://www.newyorkfed.org/medialibrary/media/research/conference/2010/cb/Lo.pdf
https://www.imf.org/en/Publications/GFSR/Issues/2019/03/27/Global-Financial-Stability-Report-April-2019
https://www.cnbc.com/2019/08/05/amazon-just-had-its-longest-losing-streak-since-january-2016.html?__twitter_impression=true&recirc=taboolainternal
https://www.cnbc.com/2019/08/15/cramer-lightning-round-everyone-should-put-10-percent-of-their-money-in-gold.html?__twitter_impression=true&recirc=taboolainternal
https://www.bloomberg.com/news/articles/2019-08-20/buy-gold-at-any-level-mobius-says-as-central-banks-cut-rates
https://stockcharts.com/h-sc/ui
YouTube Short Description:
Since the trend cycle holds for all asset classes, examining the spot gold chart against the typical pattern of a trend reveals where we are and what we can expect in the future. I believe we are coming to conclusion of the second, awareness phase in this trend cycle. More specifically, we are coming to conclusion of the bear trap that began in 2011.
For those waiting for a big pull back, I can tell you that I am not waiting. Gold is cheap at these levels and availability is ample. In other words, currently I can get any gold or silver that I need to support my personal strategy to sustain my current standard of living as we go through this next crisis, as well as, get into position to take advantage of the growth opportunities that will most likely present. The longer you wait, the most likely outcome is higher fiat prices and less availability.
So what are you waiting for?